
使用Networkx将节点大小绘制为图例
使用Networkx将节点大小绘制为图例
提问于 2022-04-02 12:47:11
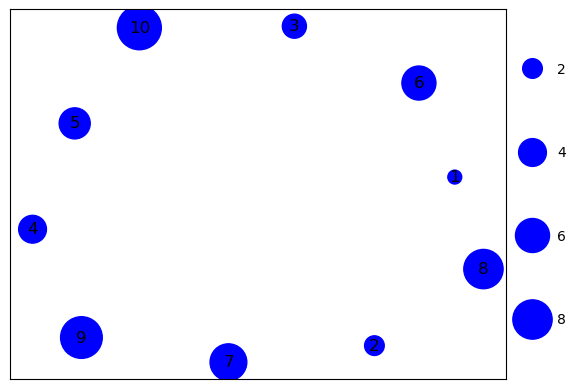
在使用NetworkX时,我绘制了一个显示与节点属性对应的节点大小的图表。若要生成一致的绘图,我希望在图例中显示节点大小。是否有一种预先实现的方法来添加一个具有定义的节点大小的数字(例如,4个)的图例,并具有相应的节点属性?
我想象一些类似于所附传说的东西。
回答 1
Stack Overflow用户
回答已采纳
发布于 2022-04-02 14:51:37
我不确定是否有一种内置的方法来做到这一点,但是networkx绘图算法使用scatter来设置节点大小,这样您就可以使用传奇中使用的分散来创建一组鬼节点。(我在编“鬼”这个词,是因为你没有真正看到它们。可能有一个正式接受的术语,我不知道。)
由于某些原因,我无法让这些工具与scatter一起工作,所以我转而使用plot。(请注意,scatter中值的大小跟随区域,而plot则遵循宽度as discussed here,因此plot中使用的鬼值的大小是networkx.draw_networkx生成的大小的平方根)。
from math import sqrt
import networkx as nx
import matplotlib.pyplot as plt

# Create graph
G = nx.Graph()
N = 10 # number of nodes
for n in range(1,N + 1):
    G.add_node(n, size = n * 100, pos = [0, n]) # size of node based on its number

# Draw graph
node_sizes = nx.get_node_attributes(G, 'size')
nx.draw_networkx(G, node_color = 'b', node_size = [v for v in node_sizes.values()])

# Make legend
for n in [2, 4, 6, 8]:
    plt.plot([], [], 'bo', markersize = sqrt(n*100), label = f"{n}")
plt.legend(labelspacing = 5, loc='center left', bbox_to_anchor=(1, 0.5), frameon = False)
页面原文内容由Stack Overflow提供。腾讯云小微IT领域专用引擎提供翻译支持
原文链接:
https://stackoverflow.com/questions/71717656
复制相关文章
相似问题
腾讯云开发者

Copyright © 2013 - 2026 Tencent Cloud. All Rights Reserved. 腾讯云 版权所有
深圳市腾讯计算机系统有限公司 ICP备案/许可证号:粤B2-20090059 ![]() 粤公网安备44030502008569号
粤公网安备44030502008569号
腾讯云计算(北京)有限责任公司 京ICP证150476号 | 京ICP备11018762号