
哨兵-2增强植被指数
我正在使用哨兵2号数据计算NDVI和增强植被指数(EVI):
NDVI <- (B8 - B4) / (B8 + B4)
## Works great
EVI <- 2.5*(B8-B4)/((B8+6*B4-7.5*B2)+1)
## Wonky
B8、B4和B2是哨兵2带的RasterLayers (B8 = VNIR,10m,842 nm,B4...etc.)
这些看起来都很好,并且可以使用更简单的NDVI计算,即使我使用B2代替B4 --它可以工作。
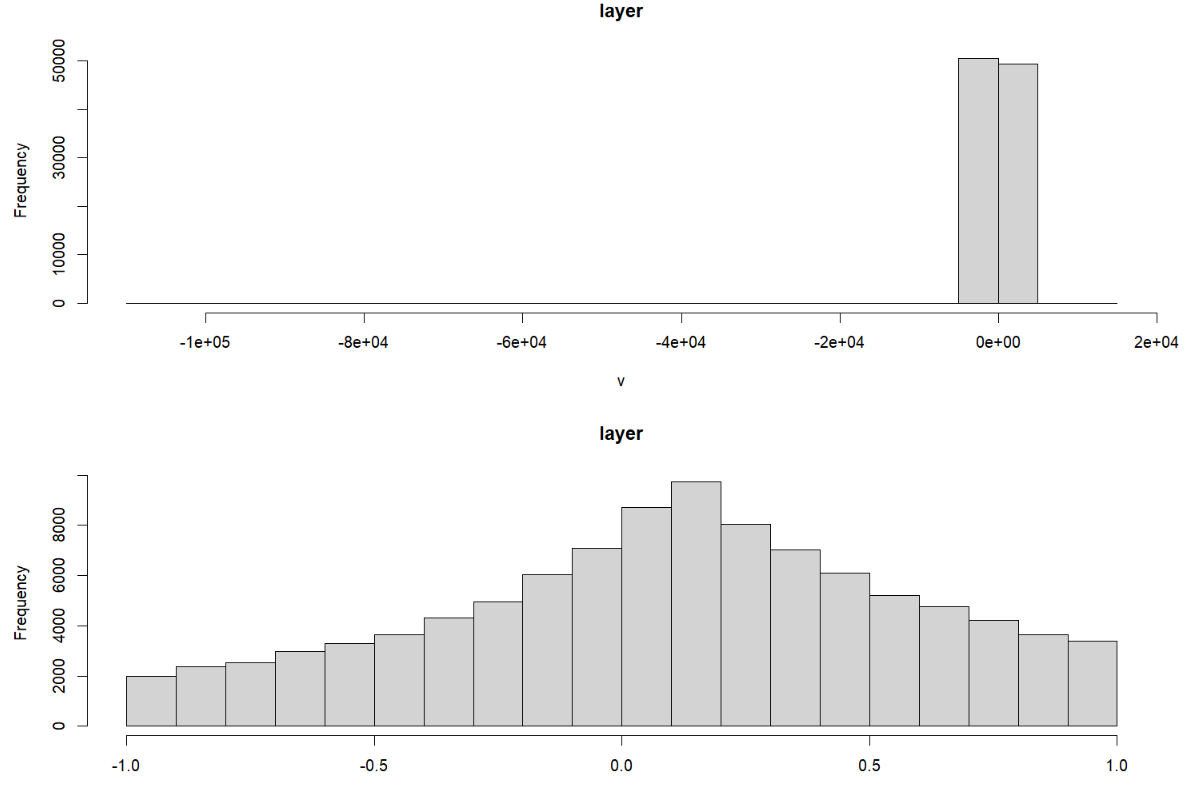
EVI (EVI)看起来像是我认为应该看的,但是如果重新计算后再绘制它,我会得到一个不同的结果:
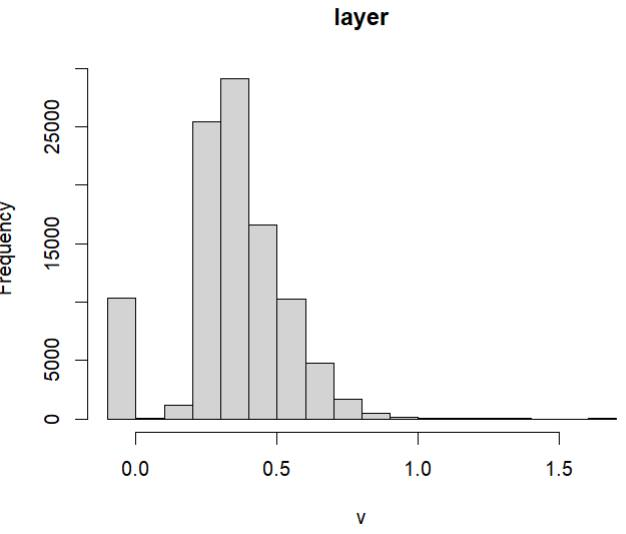
现在还会产生警告信息:
>hist(EVI)
Warning message:
In .hist1(x, maxpixels = maxpixels, main = main, plot = plot, ...) :
  0% of the raster cells were used. 100000 values used.
情节(EVI)图例从-1上升到5,但这些值似乎不匹配:
maxValue(EVI)
#[1] 3199.469
minValue(EVI)
#[1] -1370.398
quantile(EVI, probs = c(0.25,0.5,0.75))
#      25%       50%       75%
#0.2694335 0.3377984 0.4481901
EVI
#class      : RasterLayer
#dimensions : 10980, 10980, 120560400  (nrow, ncol, ncell)
#resolution : 10, 10  (x, y)
#extent     : 399960, 509760, 6190200, 6300000  (xmin, xmax, ymin, ymax)
#crs        : +proj=utm +zone=10 +datum=WGS84 +units=m +no_defs
#source     : r_tmp_2022-04-14_170725_107992_82859.grd
#names      : layer
#values     : -1370.398, 3199.469  (min, max)
问:为什么EVI值会这么高?我希望一个maxValue略大于1,minValue略小于-1。NDVI看起来没问题:
NDVI
#class      : RasterLayer
#dimensions : 10980, 10980, 120560400  (nrow, ncol, ncell)
#resolution : 10, 10  (x, y)
#extent     : 399960, 509760, 6190200, 6300000  (xmin, xmax, ymin, ymax)
#crs        : +proj=utm +zone=10 +datum=WGS84 +units=m +no_defs
#source     : r_tmp_2022-04-14_162459_107992_94886.grd
#names      : layer
#values     : -2.4375, 0.9981395  (min, max)
如果我手动插入EVI值:
> EVI_Max = 2.5 * ((maxValue(B8) - maxValue(B4)) / ((maxValue(B8) + (6*maxValue(B4)) - (7.5*maxValue(B2))) + 1))
> EVI_Max
[1] 0.1979678

> EVI_Maxb = 2.5 * ((maxValue(B8) - maxValue(B4)) / ((minValue(B8) + (6*minValue(B4)) - (7.5*minValue(B2))) + 1))
> EVI_Maxb
[1] 0.8300415

> EVI_Maxc = 2.5 * ((minValue(B8) - minValue(B4)) / ((maxValue(B8) + (6*maxValue(B4)) - (7.5*maxValue(B2))) + 1))
> EVI_Maxc
[1] 0
输入栅格数据(以砖块和堆栈的形式运行,结果相同):
B8 <- raster(sen_complete, layer=7)/10000 ##Layer7=B8
B4 <- raster(sen_complete, layer=3)/10000 ##Layer3=B4
B2 <- raster(sen_complete, layer=1)/10000 ##Layer1=B2
> sen_complete
class : RasterBrick
dimensions : 10980, 10980, 120560400, 8 (nrow, ncol, ncell, nlayers)
resolution : 10, 10 (x, y)
extent : 399960, 509760, 6190200, 6300000 (xmin, xmax, ymin, ymax)
crs : +proj=utm +zone=10 +datum=WGS84 +units=m +no_defs
source : r_tmp_2022-04-14_102523_107992_02726.grd
names : layer.1, layer.2, layer.3, layer.4, layer.5, layer.6, layer.7, layer.8
min values : 1, 1, 1, 1, 1, 0, 1, 1
max values : 7580, 8784, 12208, 12040, 14475, 15740, 15528, 15605
B8
#class : RasterLayer
#dimensions : 10980, 10980, 120560400 (nrow, ncol, ncell)
#resolution : 10, 10 (x, y)
#extent : 399960, 509760, 6190200, 6300000 (xmin, xmax, ymin, ymax)
#crs : +proj=utm +zone=10 +datum=WGS84 +units=m +no_defs
#source : r_tmp_2022-04-14_172529_107992_50061.grd
#names : layer.7
#values : 1e-04, 1.5528 (min, max)
B4
#class : RasterLayer
#dimensions : 10980, 10980, 120560400 (nrow, ncol, ncell)
#resolution : 10, 10 (x, y)
#extent : 399960, 509760, 6190200, 6300000 (xmin, xmax, ymin, ymax)
#crs : +proj=utm +zone=10 +datum=WGS84 +units=m +no_defs
#source : r_tmp_2022-04-14_172558_107992_74998.grd
#names : layer.3
#values : 1e-04, 1.2208 (min, max)
B2
#class : RasterLayer
#dimensions : 10980, 10980, 120560400 (nrow, ncol, ncell)
#resolution : 10, 10 (x, y)
#extent : 399960, 509760, 6190200, 6300000 (xmin, xmax, ymin, ymax)
#crs : +proj=utm +zone=10 +datum=WGS84 +units=m +no_defs
#source : r_tmp_2022-04-14_172617_107992_52307.grd
#names : layer.1
#values : 1e-04, 0.758 (min, max)
s <- stack(B2, B4, B8)
> s
class : RasterStack
dimensions : 10980, 10980, 120560400, 3 (nrow, ncol, ncell, nlayers)
resolution : 10, 10 (x, y)
extent : 399960, 509760, 6190200, 6300000 (xmin, xmax, ymin, ymax)
crs : +proj=utm +zone=10 +datum=WGS84 +units=m +no_defs
names : layer.1, layer.3, layer.7
min values : 1e-04, 1e-04, 1e-04
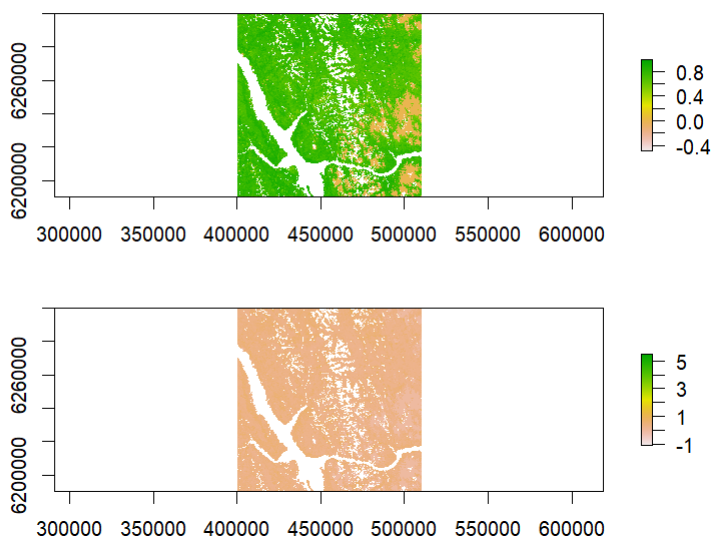
max values : 0.7580, 1.2208, 1.5528用于视觉比较的输出:
> par(mfrow=c(2,1))
> plot(NDVI)
> plot(EVI)
用随机数据重新创建:
> rtest_B8 <- raster(ncol=10980, nrow=10980)
> rtest_B4 <- raster(ncol=10980, nrow=10980)
> rtest_B2 <- raster(ncol=10980, nrow=10980)
> minValue(raster(sen_complete, layer=7))
[1] 1
> maxValue(raster(sen_complete, layer=7))
[1] 15528
> minValue(raster(sen_complete, layer=3))
[1] 1
> maxValue(raster(sen_complete, layer=3))
[1] 12208
> minValue(raster(sen_complete, layer=1))
[1] 1
> maxValue(raster(sen_complete, layer=1))
[1] 7580
> set.seed(0)
> values(rtest_B8) <- runif(ncell(rtest), min = (minValue(raster(sen_complete, layer=7))), max = maxValue(raster(sen_complete, layer=7)))
> set.seed(999)
> values(rtest_B4) <- runif(ncell(rtest), min = (minValue(raster(sen_complete, layer=3))), max = maxValue(raster(sen_complete, layer=3)))
> set.seed(-999)
> values(rtest_B2) <- runif(ncell(rtest), min = (minValue(raster(sen_complete, layer=1))), max = maxValue(raster(sen_complete, layer=1)))
> rtest_B8 <- rtest_B8/10000
> rtest_B4 <- rtest_B4/10000
> rtest_B2 <- rtest_B2/10000
> EVI_test <- 2.5*(rtest_B8-rtest_B4)/((rtest_B8+6*rtest_B4-7.5*rtest_B2)+1)
> plot(EVI_test)
> EVI_test
class : RasterLayer
dimensions : 10980, 10980, 120560400 (nrow, ncol, ncell)
resolution : 0.03278689, 0.01639344 (x, y)
extent : -180, 180, -90, 90 (xmin, xmax, ymin, ymax)
crs : +proj=longlat +datum=WGS84 +no_defs
source : r_tmp_2022-04-15_132504_107992_89378.grd
names : layer
values : -8154455, 6779455 (min, max)
> NDVI_test <- (rtest_B8 - rtest_B4) / (rtest_B8 + rtest_B4)
> plot(NDVI_test)
> NDVI_test
class : RasterLayer
dimensions : 10980, 10980, 120560400 (nrow, ncol, ncell)
resolution : 0.03278689, 0.01639344 (x, y)
extent : -180, 180, -90, 90 (xmin, xmax, ymin, ymax)
crs : +proj=longlat +datum=WGS84 +no_defs
source : r_tmp_2022-04-15_132601_107992_94720.grd
names : layer
values : -0.9998338, 0.9998693 (min, max)
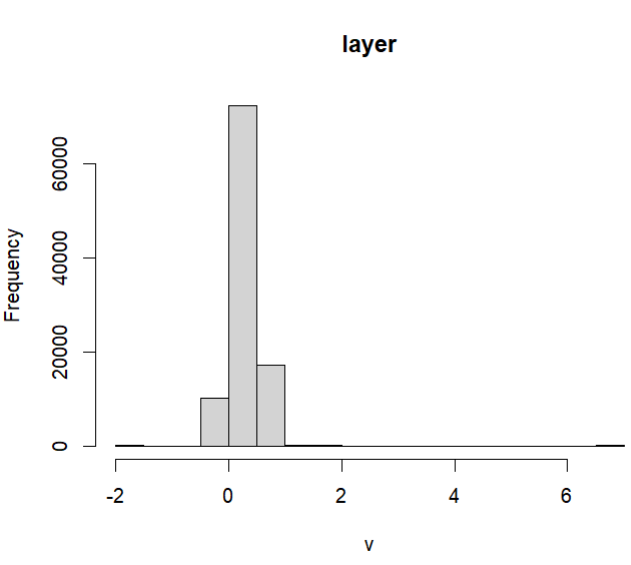
> hist(EVI_test)
Warning message:
In .hist1(x, maxpixels = maxpixels, main = main, plot = plot, ...) :
0% of the raster cells were used. 100000 values used.
> hist(NDVI_test)
Warning message:
In .hist1(x, maxpixels = maxpixels, main = main, plot = plot, ...) :
0% of the raster cells were used. 100000 values used.

> i1 <- which.max(EVI_test)
> s1 <- stack(rtest_B2, rtest_B4, rtest_B8)
> s <- stack(B2, B4, B8)
> s1[i1]
layer.1 layer.2 layer.3
[1,] 0.3627138 0.06103937 1.354118
> i2 <- which.max(EVI)
> s[i2]
NULL
> i3 <- which.max(NDVI)
> s[i3]
layer.1 layer.3 layer.7
[1,] 1e-04 1e-04 0.1074
> i4 <- which.max(NDVI_test)
> s1[i4]
layer.1 layer.2 layer.3
[1,] 0.3392011 0.0001000134 1.53007
> which.max(values(EVI))
[1] 73288066
> which.min(values(EVI))
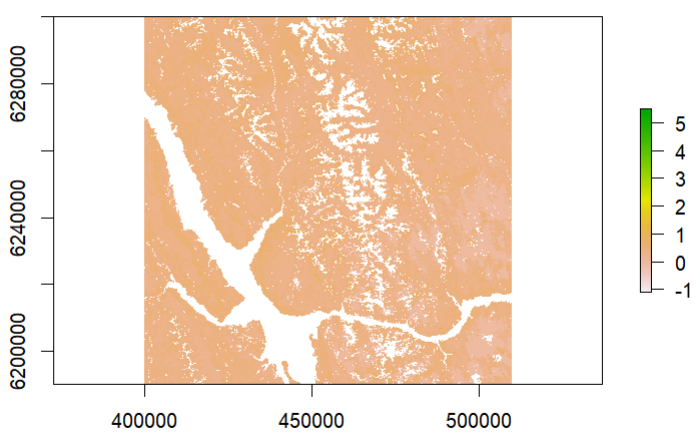
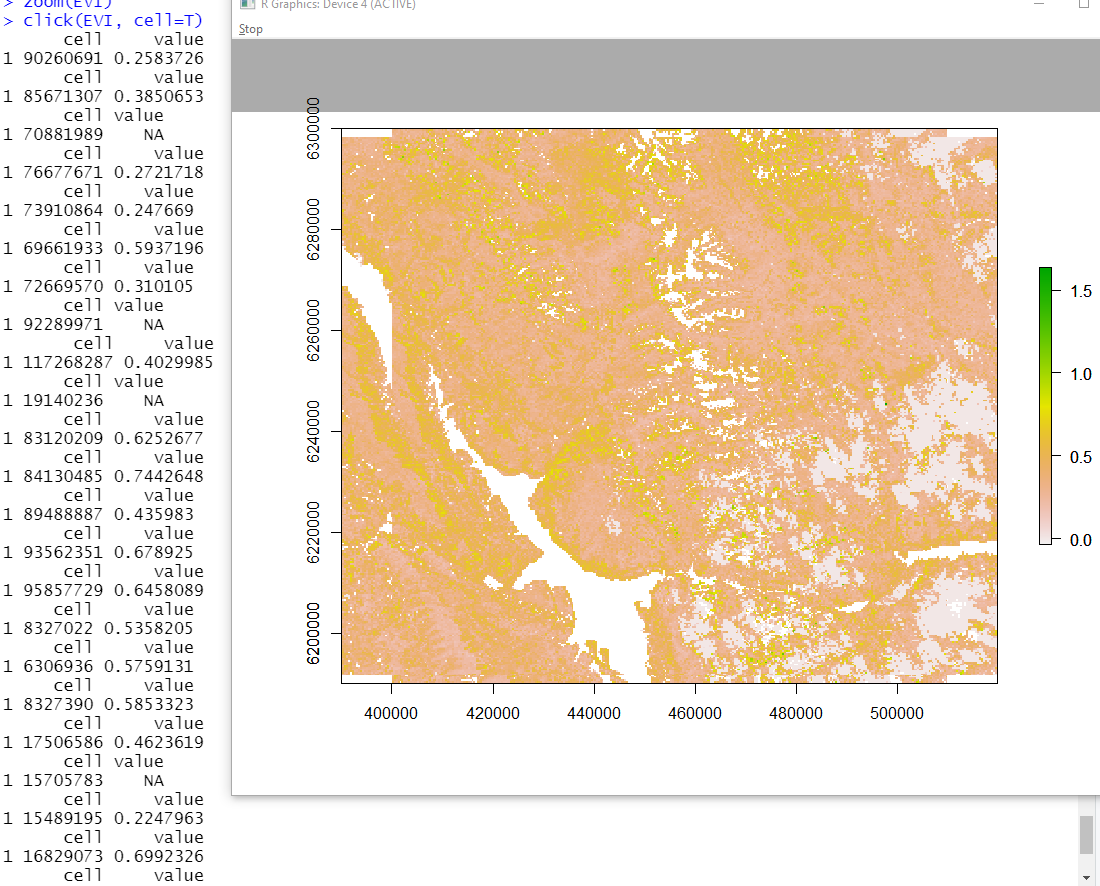
[1] 103184643添加图像的缩放和点击搜索最大的EVI,但它看起来没有任何大于1.113 -这是我的最高数字。
回答 2
Stack Overflow用户
发布于 2022-04-15 01:40:51
这个公式
EVI <- 2.5*(B8-B4)/((B8+6*B4-7.5*B2)+1) 表明分母可能非常小,这将导致较大的EVI。但是没有理由假设当所有的B都在它们的最大值时,就会达到最大的EVI。
我要做的是找到具有最大EVI值的单元格,然后查看该单元格中的输入值。也许是这样
i <- which.max(EVI)
s <- stack(B2, B4, B8)
s[i]Stack Overflow用户
发布于 2022-05-22 03:10:59
在使用更新的terra包重写脚本之后,我解决了这个问题;从光栅包中更新了我的代码。terra包提供了以下解决方案:重新采样{terra}
注释指出:“最近的neighbor...It不是连续值的好选择。如果x的第一层是绝对的,默认情况下使用它。”
我的问题与哨兵-2场景分类(SCL)和云(Cld)分类层有关,它们是分类数据:
1:饱和缺陷,2:暗特征阴影,3:云影,4:植被,5:非植被,6:水,7:未分类,8:云中概率,9:云高概率,10:薄卷,11:雪冰。
我使用的光栅重采样计算方法是调用method=bilinear。这将离散(因子/分类)转换为连续数据,并导致掩蔽过程中的错误。用method=near和class: SpatRaster对编码进行修复。
https://stackoverflow.com/questions/71879090
复制相似问题
腾讯云开发者

Copyright © 2013 - 2026 Tencent Cloud. All Rights Reserved. 腾讯云 版权所有
深圳市腾讯计算机系统有限公司 ICP备案/许可证号:粤B2-20090059 ![]() 粤公网安备44030502008569号
粤公网安备44030502008569号
腾讯云计算(北京)有限责任公司 京ICP证150476号 | 京ICP备11018762号