
ggplot与scale_x_continuous
ggplot与scale_x_continuous
提问于 2022-04-21 15:45:50
这里是一个数据样本:
library(ggplot2)
lbreaks=c(-800,-600,-400,-300,-200,-100,-75,-50,-25,0,25,50)
ddf=data.frame(x=lbreaks,
y=seq(1,length(lbreaks),1))
以及相应的散点图
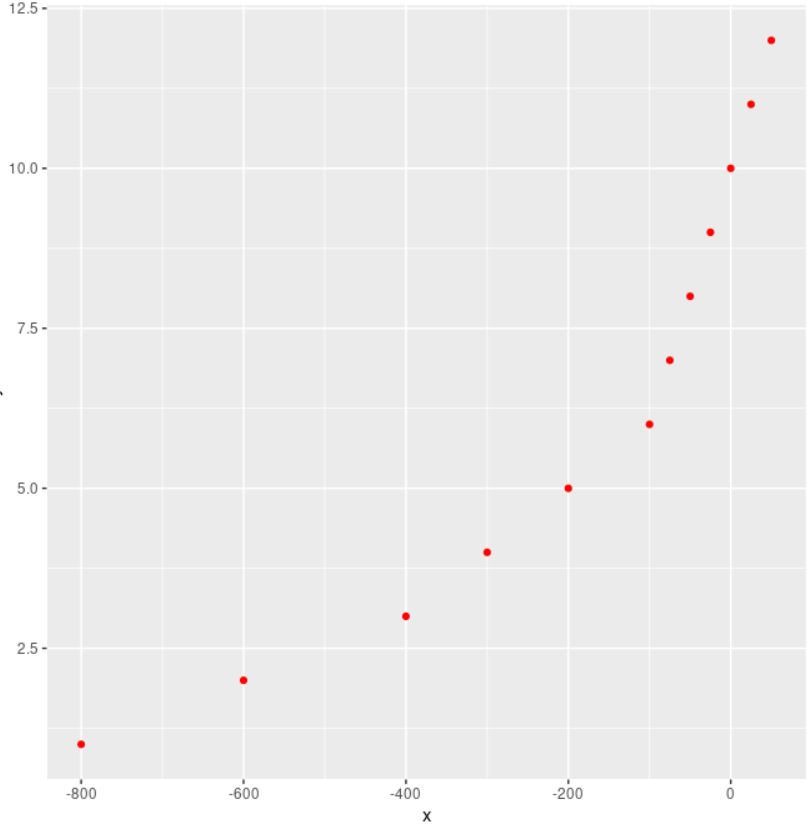
对于x轴值,我会使用自定义标度(log或类似的值)来生成相同间距的x值的散射点。我试图在scale_x_continuous(trans =中使用几个函数,但没有成功。我怎么能这么做?非常感谢你的帮助,
回答 1
Stack Overflow用户
发布于 2022-04-21 15:51:36
如果您希望x轴断裂的间隔均匀,最简单的方法是:
ggplot(ddf, aes(factor(x), y)) +
  geom_point(colour = 'red') +
  labs(x = 'x')
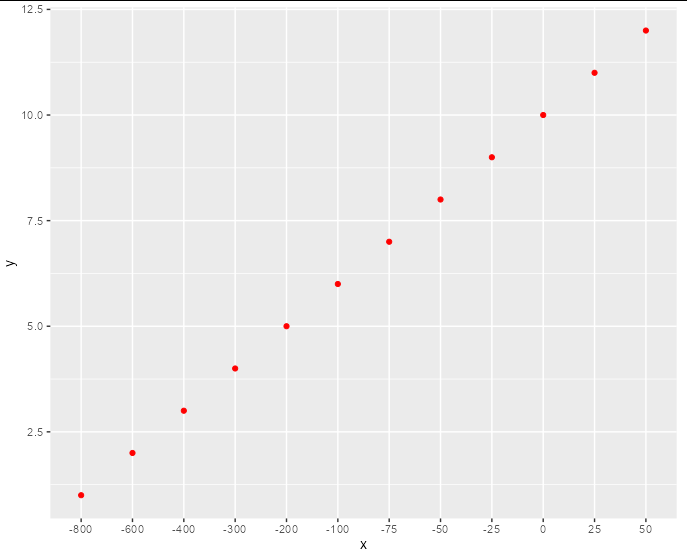
也许不那么轻率,您的特定转换只有通过分段转换功能才能真正准确地实现:
my_trans <- scales::trans_new('custom',
                      transform = function(x) {
                        dplyr::case_when(
                          x < -400 ~ (x + 800) / 200 + 1,
                          x < -100 ~ (x + 400) / 100 + 3,
                          TRUE ~ (x + 100) / 25 + 6)
                      },
                      inverse = function(x) {
                        dplyr::case_when(
                          x < 3 ~ (x - 1) * 200 - 800,
                          x < 6 ~ (x - 3) * 100 - 400,
                          TRUE ~ (x - 6) * 25 - 100)
                      })


ggplot(ddf, aes(x, y)) +
  geom_point(colour = 'red') +
  scale_x_continuous(trans = my_trans, breaks = lbreaks)
这允许传递任意数据:
ddf=data.frame( x=rnorm(100,mean=-500,sd=200), y=rnorm(100,mean=0.5,sd=0.2) )

ggplot(ddf, aes(x, y)) +
  geom_point(colour = 'red') +
  scale_x_continuous(trans = my_trans, breaks = lbreaks)
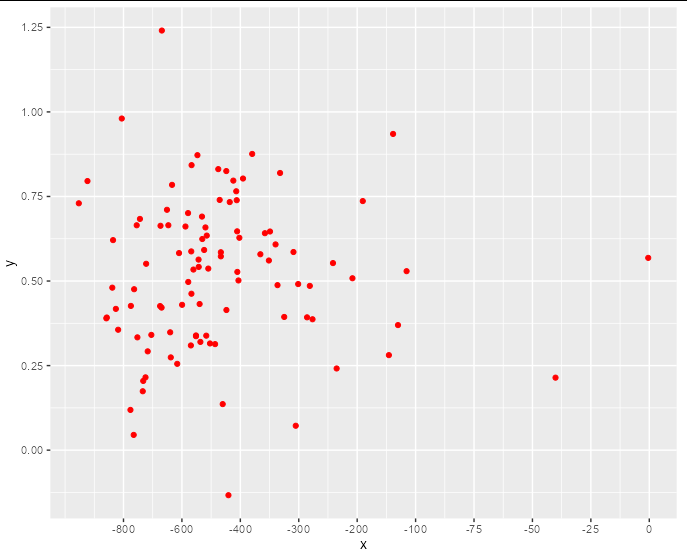
然而,这种任意的x轴操作并不理想,因为它们可能会误导人。
页面原文内容由Stack Overflow提供。腾讯云小微IT领域专用引擎提供翻译支持
原文链接:
https://stackoverflow.com/questions/71957275
复制相关文章
相似问题
腾讯云开发者
