
在相对丰度栏之上添加类别的总值,Python
在相对丰度栏之上添加类别的总值,Python
提问于 2022-04-28 11:59:37
我用的是这样一个相对丰富的情节:
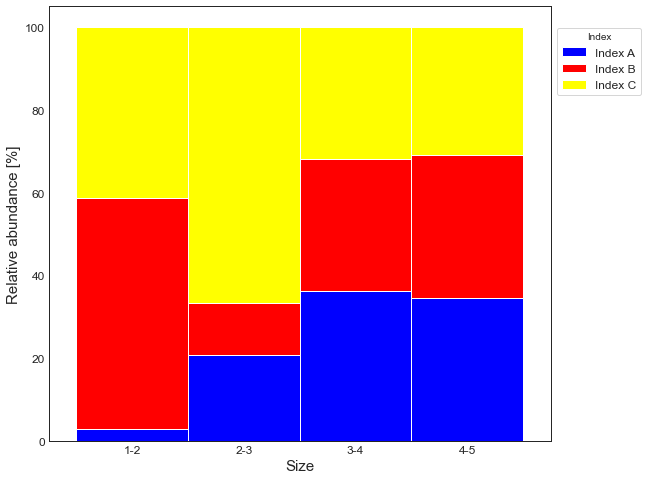
但是需要帮助在每个条形图上显示类别值的总数。其结果应该是:

是啊。每个x轴类别('1-2','2-3','3-4','4-5')的计数量。
我的代码:
import pandas as pd
import matplotlib.pyplot as plt

data = {'Index A':[1,5,8,9],'Index B':[19,3,7,9],'Index C':[14,16,7,8]}
stacked_data = pd.DataFrame(data, index=['1-2','2-3','3-4','4-5'])

stacked_data = stacked_data.apply(lambda x: x*100/sum(x), axis=1)
list_of_colors = ['blue','red','yellow']
ax = stacked_data.plot(kind='bar', stacked=True, width=1, figsize=(9,8), edgecolor=None, color=list_of_colors)

plt.xlabel('Size', fontsize=15)
plt.ylabel('Relative abundance [%]', fontsize=15)
plt.xticks(fontsize=12, rotation=360)
plt.yticks(fontsize=12)
plt.legend(bbox_to_anchor=(1, .965), facecolor='white',loc=0, frameon=True, fontsize=12,title='Index')

plt.show()
任何帮助都是非常感谢的!
回答 1
Stack Overflow用户
回答已采纳
发布于 2022-04-28 13:17:58
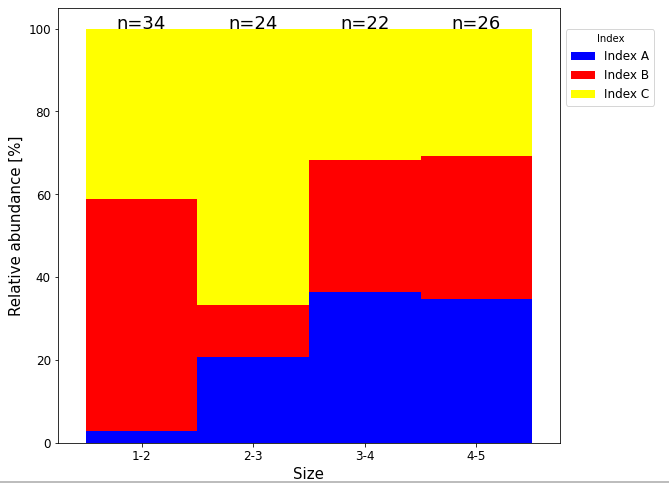
在计算数据帧的相对值之前,得到数据帧的总值。用这些总价值的列表和图的x轴检索到的标签列表进行注释。注释的坐标基础是基于数据的。
import pandas as pd
import matplotlib.pyplot as plt

data = {'Index A':[1,5,8,9],'Index B':[19,3,7,9],'Index C':[14,16,7,8]}
stacked_data = pd.DataFrame(data, index=['1-2','2-3','3-4','4-5'])
total_data = stacked_data.sum(axis=1)
# print(total_data)
stacked_data = stacked_data.apply(lambda x: x*100/sum(x), axis=1)
list_of_colors = ['blue','red','yellow']
ax = stacked_data.plot(kind='bar', stacked=True, width=1, figsize=(9,8), edgecolor=None, color=list_of_colors)

plt.xlabel('Size', fontsize=15)
plt.ylabel('Relative abundance [%]', fontsize=15)
plt.xticks(fontsize=12, rotation=360)
plt.yticks(fontsize=12)
plt.legend(bbox_to_anchor=(1, .965), facecolor='white',loc=0, frameon=True, fontsize=12, title='Index')

# print(ax.get_xticklabels())
for i,(n,idx) in enumerate(zip(total_data,ax.get_xticklabels())):
    ax.text(x=idx.get_position()[0], y=100, s='n={}'.format(n), ha='center', fontdict={'size':18}, transform=ax.transData)

plt.show()
页面原文内容由Stack Overflow提供。腾讯云小微IT领域专用引擎提供翻译支持
原文链接:
https://stackoverflow.com/questions/72043288
复制相关文章
相似问题
腾讯云开发者
