
用python码从图像中估计重叠纤维的长度
用python码从图像中估计重叠纤维的长度
提问于 2022-05-09 06:40:18
我需要帮助估计准确的纤维长度从图像。我在python中开发了代码,通过它可以在一定程度上估计长度。
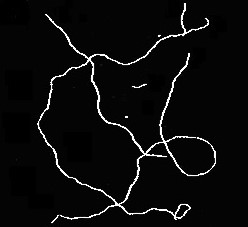
利用Skan开放源码库,从光纤的skeletonized图像中获取纤维段的直径和长度。我正面临着在重叠点或交界处追踪光纤以进行长度估计的挑战。目前,估计的长度比实际图像要小得多,因为它只估计从光纤端点到连接点的线段长度。如果有人能帮助估计所有重叠纤维的长度,那将是有帮助的。共享code和原始图像以供参考。
import cv2
import numpy as np
from matplotlib import pyplot as plt
from skimage.morphology import skeletonize
from skimage import morphology

img00 = cv2.imread(r'original_img.jpg')
img_01 = cv2.cvtColor(img00, cv2.COLOR_BGR2GRAY)
img0 = cv2.cvtColor(img00, cv2.COLOR_BGR2GRAY)

i_size = min(np.size(img_01,1),600) # image size for imshow
# Creating kernel
kernel = np.ones((2, 2), np.uint8)

# Using cv2.dialate() method
img01 = cv2.dilate(img0, kernel, iterations=2)
cv2.imwrite('Img1_Filtered.jpg',img01)

ret,thresh1 = cv2.threshold(img01,245,255,cv2.THRESH_BINARY)
thresh = (thresh1/255).astype(np.uint8)
cv2.imwrite('Img2_Binary.jpg',thresh1)

# skeleton based on Lee's method
skeleton1 = (skeletonize(thresh, method='lee')/255).astype(bool)
skeleton1 = morphology.remove_small_objects(skeleton1, 100, connectivity=2)

# fiber Detection through skeletonization and its characterization
from skan import draw, Skeleton, summarize
spacing_nm = 1   # pixel

fig, ax = plt.subplots()
draw.overlay_skeleton_2d(img_01, skeleton1, dilate=1, axes=ax);

from skan.csr import skeleton_to_csgraph
pixel_graph, coordinates0 = skeleton_to_csgraph(skeleton1, spacing=spacing_nm)

skel_analysis = Skeleton(skeleton1, spacing=spacing_nm,source_image=img00)
branch_data = summarize(skel_analysis)
branch_data.hist(column='branch-distance', bins=100);
draw.overlay_euclidean_skeleton_2d(img_01, branch_data,skeleton_color_source='branch-type');

from scipy import ndimage
dd = ndimage.distance_transform_edt(thresh)
radii = np.multiply(dd, skeleton1);
Fiber_D_mean = np.mean(2*radii[radii>0]);
criteria = 2 * Fiber_D_mean; # Remove branches smaller than this length for characterization

aa = branch_data[(branch_data['branch-distance']>criteria)];
CNT_L_count, CNT_L_mean, CNT_L_stdev = aa['branch-distance'].describe().loc[['count','mean','std']]
print("Fiber Length (px[enter image description here][1]) : Count, Average, Stdev:",int(CNT_L_count),round(CNT_L_mean,2),round(CNT_L_stdev,2))Stack Overflow用户
回答已采纳
发布于 2022-05-11 07:17:00
从骨架开始,我将进行如下工作:
junctions
- calculate
- 将骨架转换为路径图
- ,为每对路径标识有效的
- ,即每条相邻路径之间的夹角,即几乎笔直穿过交叉口的
- 合并路径。
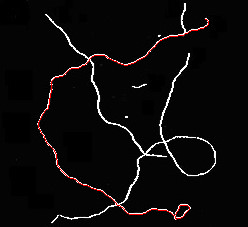
这是一幅草图,可以在骨骼中找到重叠的纤维。我让你来优化它,使它对现实生活中的图像健壮,以及如何从结果中得出统计数据。
import cv2
import numpy as np
from skimage import morphology, graph
from skan import Skeleton
MAX_JUNCTION = 4 # maximal size of junctions
MAX_ANGLE = 80 # maximal angle in junction
DELTA = 3 # distance from endpoint to inner point to estimate direction at endpoint
def angle(v1, v2):
rad = np.arctan2(v2[0], v2[1]) - np.arctan2(v1[0], v1[1])
return np.abs((np.rad2deg(rad) % 360) - 180)
img = cv2.imread('img.jpg')
gray = cv2.cvtColor(img, cv2.COLOR_BGR2GRAY)
# dilate and threshold
kernel = np.ones((2, 2), np.uint8)
dilated = cv2.dilate(gray, kernel, iterations=1)
ret, thresh = cv2.threshold(dilated, 245, 255, cv2.THRESH_BINARY)
# skeletonize
skeleton = morphology.skeletonize(thresh, method='lee')
skeleton = morphology.remove_small_objects(skeleton.astype(bool), 100, connectivity=2)
# split skeleton into paths, for each path longer than MAX_JUNCTION get list of point coordinates
g = Skeleton(skeleton)
lengths = np.array(g.path_lengths())
paths = [list(np.array(g.path_coordinates(i)).astype(int)) for i in range(g.n_paths) if lengths[i] > MAX_JUNCTION]
# get endpoints of path and vector to inner point to estimate direction at endpoint
endpoints = [[p[0], np.subtract(p[0], p[DELTA]), i] for i, p in enumerate(paths)] +\
[[p[-1], np.subtract(p[-1], p[-1 - DELTA]), i] for i, p in enumerate(paths)]
# get each pair of distinct endpoints with the same junction and calculate deviation of angle
angles = []
costs = np.where(skeleton, 1, 255) # cost array for route_through_array
for i1 in range(len(endpoints)):
for i2 in range(i1 + 1, len(endpoints)):
e1, d1, p1 = endpoints[i1]
e2, d2, p2 = endpoints[i2]
if p1 != p2:
p, c = graph.route_through_array(costs, e1, e2) # check connectivity of endpoints at junction
if c <= MAX_JUNCTION:
deg = angle(d1, d2) # get deviation of directions at junction
if deg <= MAX_ANGLE:
angles.append((deg, i1, i2, p))
# merge paths, with least deviation of angle first
angles.sort(key=lambda a: a[0])
for deg, i1, i2, p in angles:
e1, e2 = endpoints[i1], endpoints[i2]
if e1 and e2:
p1, p2 = e1[2], e2[2]
paths[p1] = paths[p1] + paths[p2] + p # merge path 2 into path 1, add junction from route_through_array
for i, e in enumerate(endpoints): # switch path 2 at other endpoint to new merged path 1
if e and e[2] == p2:
endpoints[i][2] = p1
paths[p2], endpoints[i1], endpoints[i2] = [], [], [] # disable merged path and endpoints
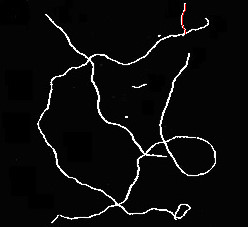
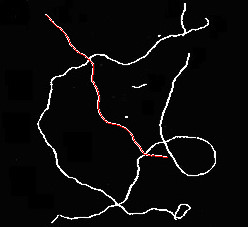
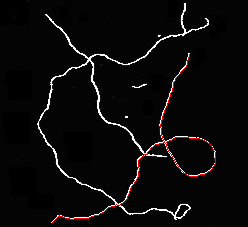
# display results
for p in paths:
if p:
img1 = img.copy()
for v in p:
img1[v[0], v[1]] = [0, 0, 255]
cv2.imshow(f'fiber', img1)
cv2.waitKey(0)
cv2.destroyAllWindows()
页面原文内容由Stack Overflow提供。腾讯云小微IT领域专用引擎提供翻译支持
原文链接:
https://stackoverflow.com/questions/72167844
复制相关文章
相似问题
腾讯云开发者
