
在Networkx中创建具有曲线和标号边的图形
在Networkx中创建具有曲线和标号边的图形
提问于 2022-05-10 07:24:39
我目前正在用nx.draw显示有向图,有几个节点和边缘连接它们。边缘通过nx.draw_networkx_edge_labels标记。
现在,我想通过设置connectionstyle来“减轻”图形的“刚性”方面,它可以很好地处理没有标签的边。
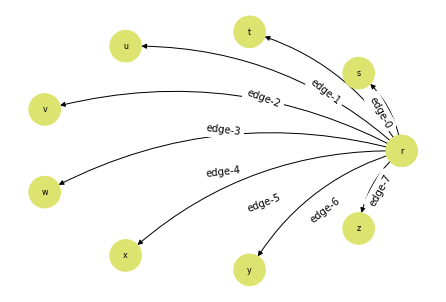
问题是,如果我显示标签,它们的绘制就好像边缘不是弯曲的,这最终在边缘和标签之间产生了巨大的偏移。
有办法解决这个限制吗?我找不到nx.draw_networkx_edge_labels的“抵消”选项来解决这个问题。
编辑:
上面是这个问题的一个快速例子:
import matplotlib.pyplot as plt
import networkx as nx

tab = ("r", ["s", "t", "u", "v", "w", "x", "y", "z"])

producer = tab[0]
consumers = tab[1]

color_map = []
DG = nx.DiGraph()
for i, cons in enumerate(consumers):
    DG.add_edge(producer, cons, label=f"edge-{i}")

for i in range(len(DG.nodes())):
    if i < 1 + len(consumers):
        color_map.append("#DCE46F")
    else:
        color_map.append("#6FA2E4")
pos = nx.shell_layout(DG)
labels = nx.get_edge_attributes(DG, 'label')
nx.draw(DG, pos, node_color=color_map, connectionstyle="arc3, rad=0.2", with_labels=True, font_size=8, node_size=1000, node_shape='o')
nx.draw_networkx_edge_labels(DG, pos, edge_labels=labels)

plt.show()
当前产出:
回答 1
Stack Overflow用户
回答已采纳
发布于 2022-05-10 10:11:40
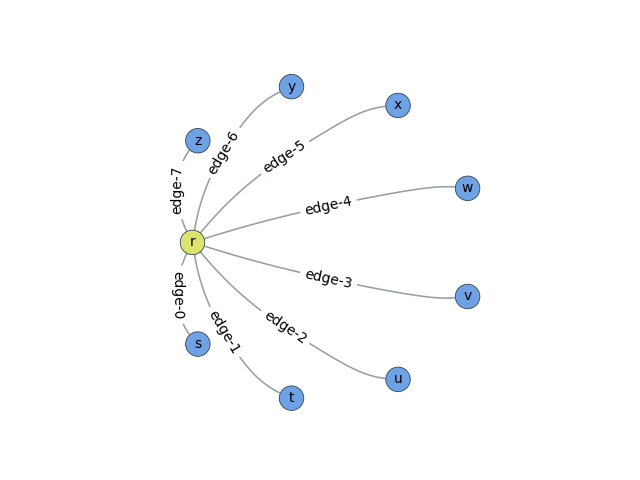
如果您愿意使用其他库进行可视化,我编写(并维护)了netgraph。在netgraph中,边缘标签跟踪边缘,即使它们是弯曲的。
import numpy as np
import matplotlib.pyplot as plt
import networkx as nx

from netgraph import Graph # pip install netgraph

tab = ("r", ["s", "t", "u", "v", "w", "x", "y", "z"])

producer = tab[0]
consumers = tab[1]

DG = nx.DiGraph()
for i, cons in enumerate(consumers):
    DG.add_edge(producer, cons, label=f"edge-{i}")

node_color = dict()
for node in DG:
    if node in producer:
        node_color[node] = "#DCE46F"
    else:
        node_color[node] = "#6FA2E4"

pos = nx.shell_layout(DG)
pos[producer] = pos[producer] + np.array([0.2, 0])
edge_labels = nx.get_edge_attributes(DG, 'label')

Graph(DG, node_layout=pos, edge_layout='curved', origin=(-1, -1), scale=(2, 2),
      node_color=node_color, node_size=8.,
      node_labels=True, node_label_fontdict=dict(size=10),
      edge_labels=edge_labels, edge_label_fontdict=dict(size=10),
)
plt.show()页面原文内容由Stack Overflow提供。腾讯云小微IT领域专用引擎提供翻译支持
原文链接:
https://stackoverflow.com/questions/72182196
复制相关文章
相似问题
腾讯云开发者

Copyright © 2013 - 2026 Tencent Cloud. All Rights Reserved. 腾讯云 版权所有
深圳市腾讯计算机系统有限公司 ICP备案/许可证号:粤B2-20090059  粤公网安备44030502008569号
腾讯云计算(北京)有限责任公司 京ICP证150476号 | 京ICP备11018762号