
将hist()和boxplot()对象转换为ggplot()对象,以便在R中使用plot_grid()对齐绘图包中的绘图
将hist()和boxplot()对象转换为ggplot()对象,以便在R中使用plot_grid()对齐绘图包中的绘图
提问于 2022-05-18 12:18:37
我正在检查我的数据是否正常,并创建了盒图- boxplot()、直方图- hist()和ggqqplots() (使用ggpubr包,它与ggplot对齐)。数据显示使用Raven软件测量光谱图中的声学参数。
对于这个项目,我需要直观地表示我的结果,并且我希望在plot_grid()包中使用cowplot对齐我的9列和3行的情节。我已经生成了9个盒图、9个直方图和9个ggqqplot()对象。
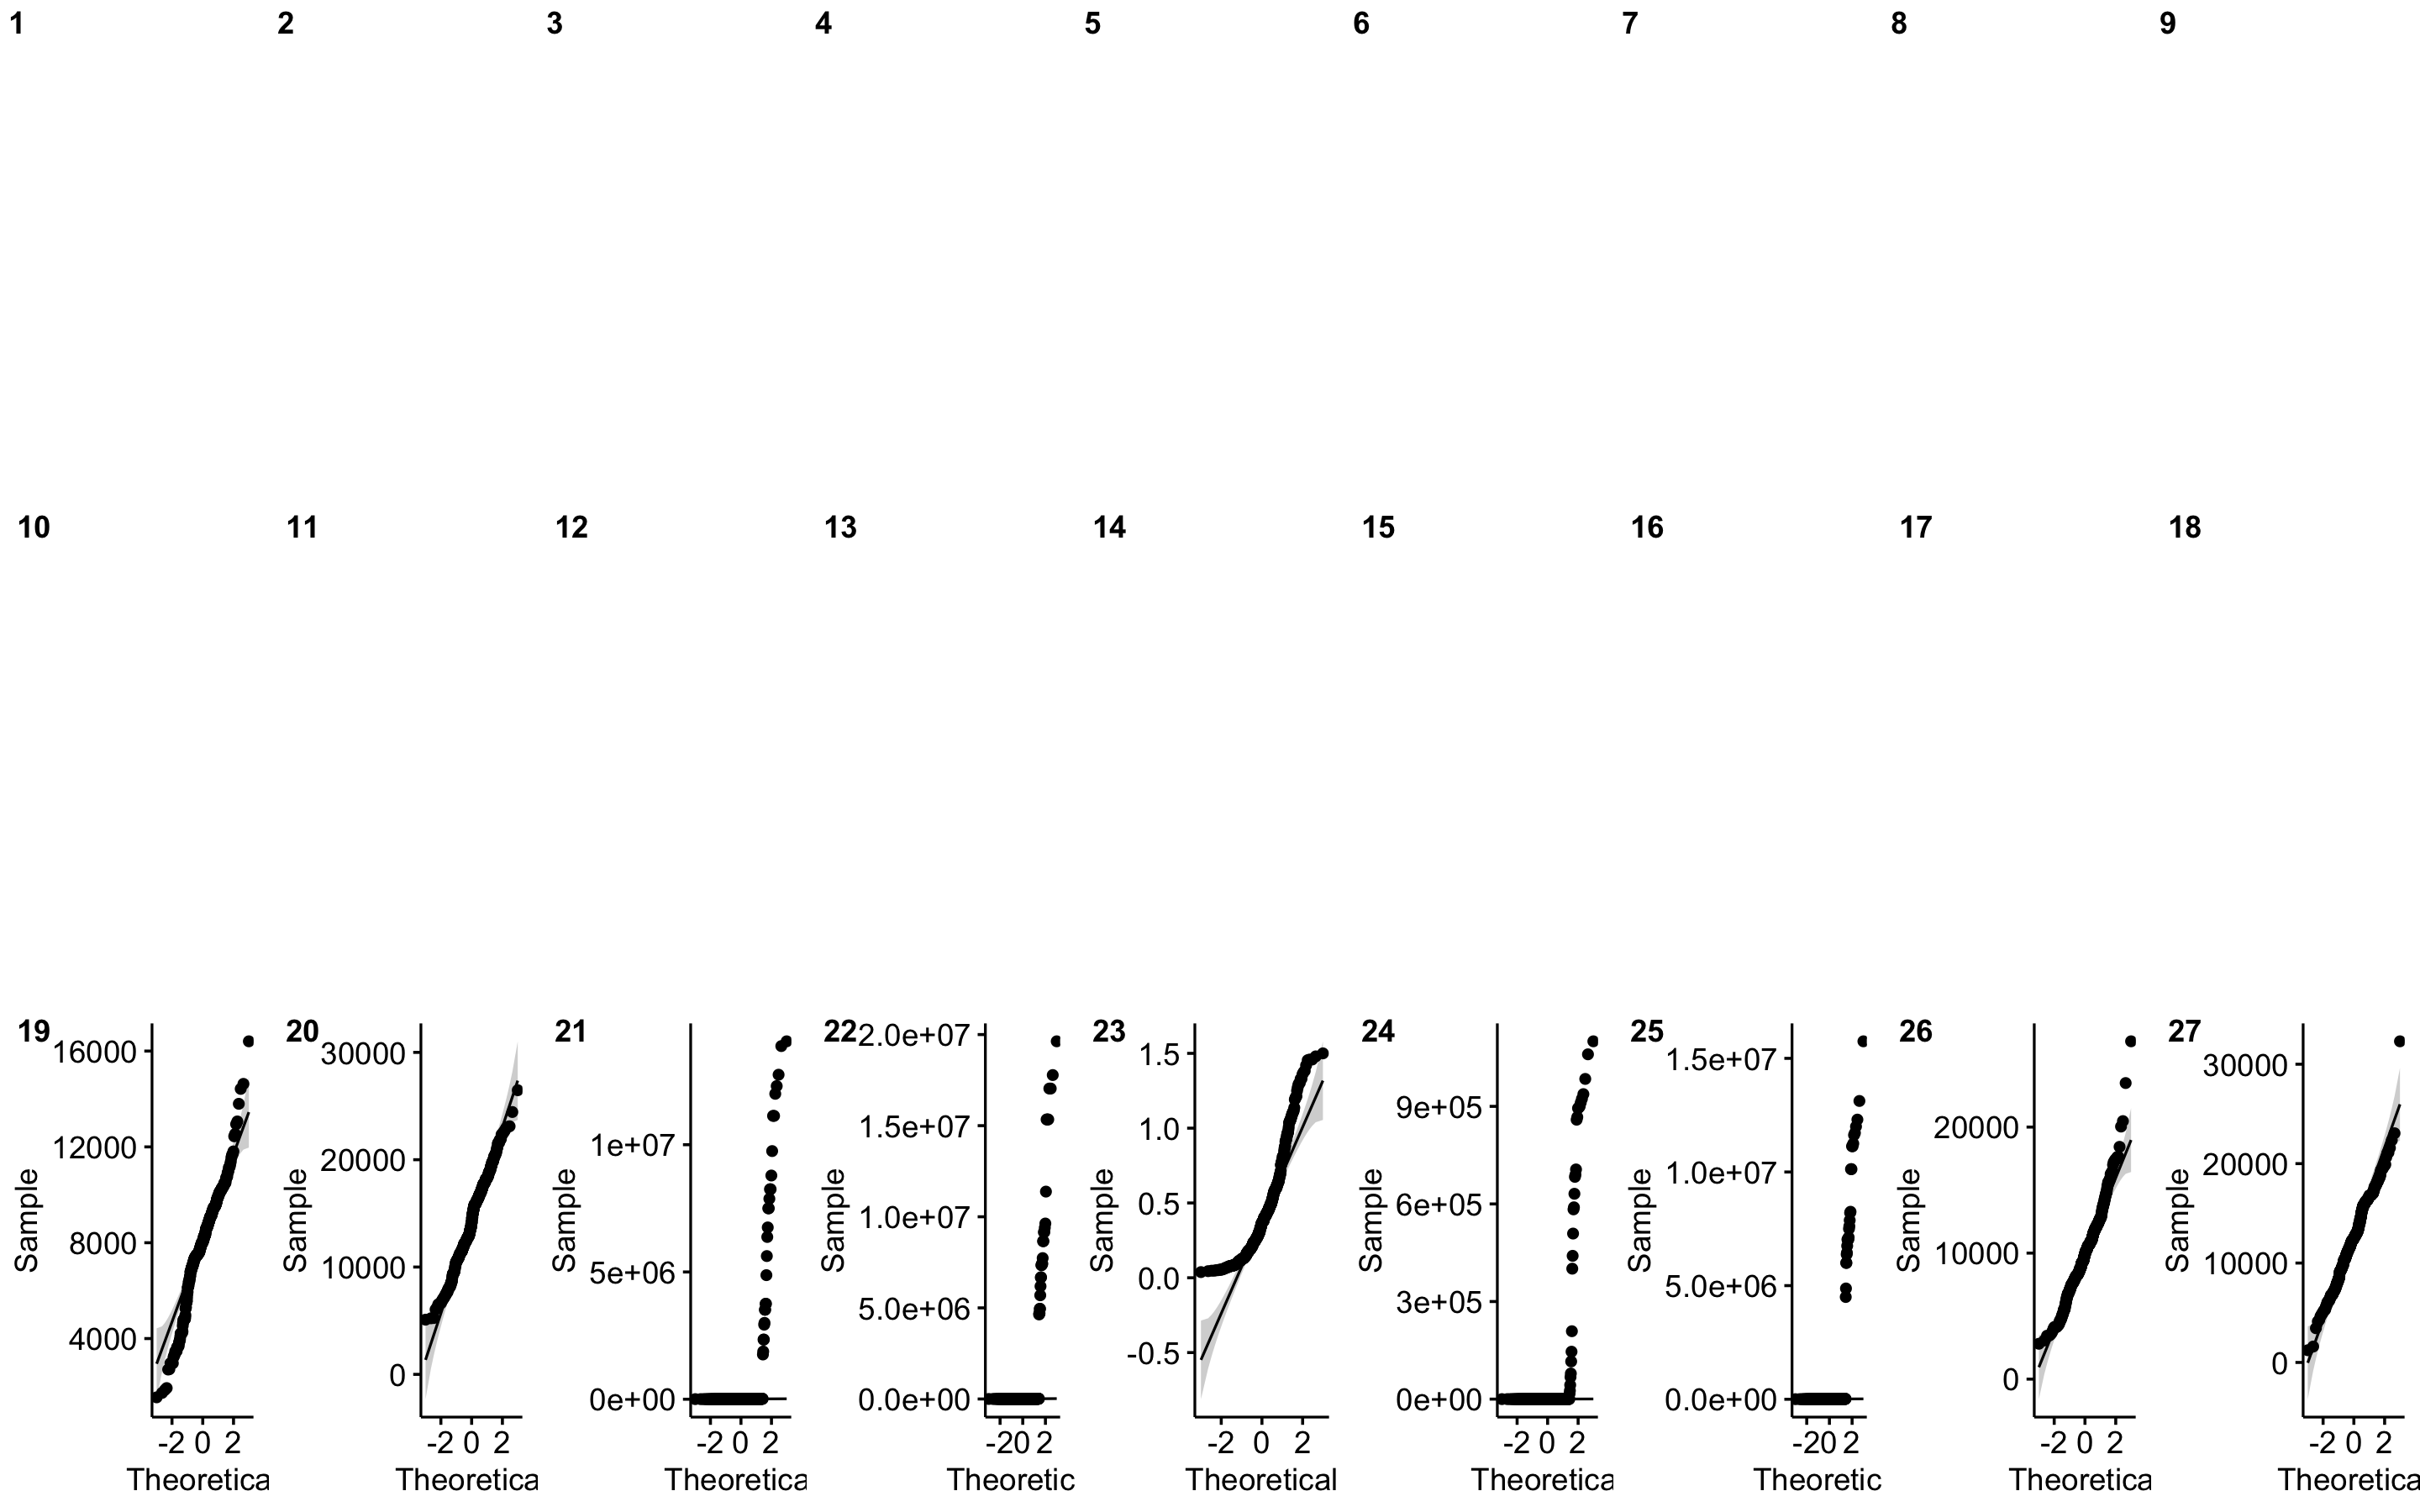
当我试图使用plot_grid()函数对齐我的绘图时,打印的qqggplot()对象,但是hist()和boxplots()对象没有(参见图1)。我了解到我需要将我的hist()和boxplot()对象转换为grob对象。
我发现一个网站(下面)可以使用as.glob()或as.ggplot()转换我的图表。我使用了下面这个链接中的信息,尽管没有成功。
在我尝试使用hist()函数将我的boxplot()和boxplot()对象转换为grob object (因此它们类似于plot_grid()命令的ggplot对象)之后,我得到了错误消息2(参见下面)。
R码
#Install library packages
library("ggpubr")
library("grid")
library("ggplotify")
library(ggplot2)
library(cowplot)

#Box plots
Low_Freq_Box<-boxplot(main_path$Low.Freq..Hz.)
High_Freq_Box<-boxplot(main_path$High.Freq..Hz.)
Peak_Freq_Box<-boxplot(main_path$Peak.Freq..Hz.)
Delta_Freq_Box<-boxplot(main_path$Delta.Freq..Hz.)
Peak_Time_Box<-boxplot(main_path$ Peak.Time..s.)
Delta_Time_Box<-boxplot(main_path$Delta.Time..s.)
Center_Freq_Box<-boxplot(main_path$Center.Freq..Hz.)
Start_Freq_Box<-boxplot(main_path$Start.Freq..Hz.)
End_Freq_Box<-boxplot(main_path$End.Freq..Hz.)

#Histograms
Low_Freq_hist<-hist(main_path$Low.Freq..Hz.)
High_Freq_hist<-hist(main_path$High.Freq..Hz.)
Peak_Freq_hist<-hist(main_path$Peak.Freq..Hz.)
Delta_Freq_hist<-hist(main_path$Delta.Freq..Hz.)
Peak_Time_hist<-hist(main_path$Peak.Time..s.)
Delta_Time_hist<-hist(main_path$Delta.Time..s.)
Center_Freq_hist<-hist(main_path$Center.Freq..Hz.)
Start_Freq_hist<-hist(main_path$Start.Freq..Hz.)
End_Freq_hist<-hist(main_path$End.Freq..Hz.)

#QQ Plots
Low_Freq_qqplot<-ggqqplot(main_path$Low.Freq..Hz.)
High_Freq_qqplot<-ggqqplot(main_path$High.Freq..Hz.)
Peak_Freq_qqplot<-ggqqplot(main_path$Peak.Freq..Hz.)
Delta_Freq_qqplot<-ggqqplot(main_path$Delta.Freq..Hz.)
Delta_Time_qqplot<-ggqqplot(main_path$Delta.Time..s.)
Peak_Time_qqplot<-ggqqplot(main_path$Peak.Time..s.)
Center_Freq_qqplot<-ggqqplot(main_path$Center.Freq..Hz.)
Start_Freq_qqplot<-ggqqplot(main_path$Start.Freq..Hz.)
End_Freq_qqplot<-ggqqplot(main_path$End.Freq..Hz.)
错误消息1
#Plot the box plots, histograms, and qqplots on the same grid
plot_grid(Low_Freq_Box, High_Freq_Box, Peak_Freq_Box, Delta_Freq_Box, Peak_Time_Box, Delta_Time_Box, Center_Freq_Box, Start_Freq_Box, End_Freq_Box,
          Low_Freq_hist, High_Freq_hist, Peak_Freq_hist, Delta_Freq_hist, Peak_Time_hist, Delta_Time_hist, Center_Freq_hist, Start_Freq_hist, End_Freq_hist,
          Low_Freq_qqplot, High_Freq_qqplot, Peak_Freq_qqplot, Delta_Freq_qqplot, Delta_Time_qqplot, Peak_Time_qqplot, Center_Freq_qqplot, Start_Freq_qqplot, End_Freq_qqplot,
          labels=c("1", "2", "3", "4", "5", "6", "7", "8", "9", "10", "11", "12", "13", "14', 15", "16", "17", "18", "19", "20", "21", "22", "23", "24", "25", "26", "27"),
          ncol=9, nrow=3)

    #Warning Messages
plot_grid(Low_Freq_Box, High_Freq_Box, Peak_Freq_Box, Delta_Freq_Box, Peak_Time_Box, Delta_Time_Box, Center_Freq_Box, Start_Freq_Box, End_Freq_Box,
+           Low_Freq_hist, High_Freq_hist, Peak_Freq_hist, Delta_Freq_hist, Peak_Time_hist, Delta_Time_hist, Center_Freq_hist, Start_Freq_hist, End_Freq_hist,
+           Low_Freq_qqplot, High_Freq_qqplot, Peak_Freq_qqplot, Delta_Freq_qqplot, Delta_Time_qqplot, Peak_Time_qqplot, Center_Freq_qqplot, Start_Freq_qqplot, End_Freq_qqplot,
+           labels=c("1", "2", "3", "4", "5", "6", "7", "8", "9", "10", "11", "12", "13", "14", "15", "16", "17", "18", "19", "20", "21", "22", "23", "24", "25", "26", "27"),
+           ncol=9, nrow=3,
+           align="hv",
+           label_size = 12)
There were 20 warnings (use warnings() to see them)
图1
回答 2
Stack Overflow用户
回答已采纳
发布于 2022-05-19 08:48:40
答案:
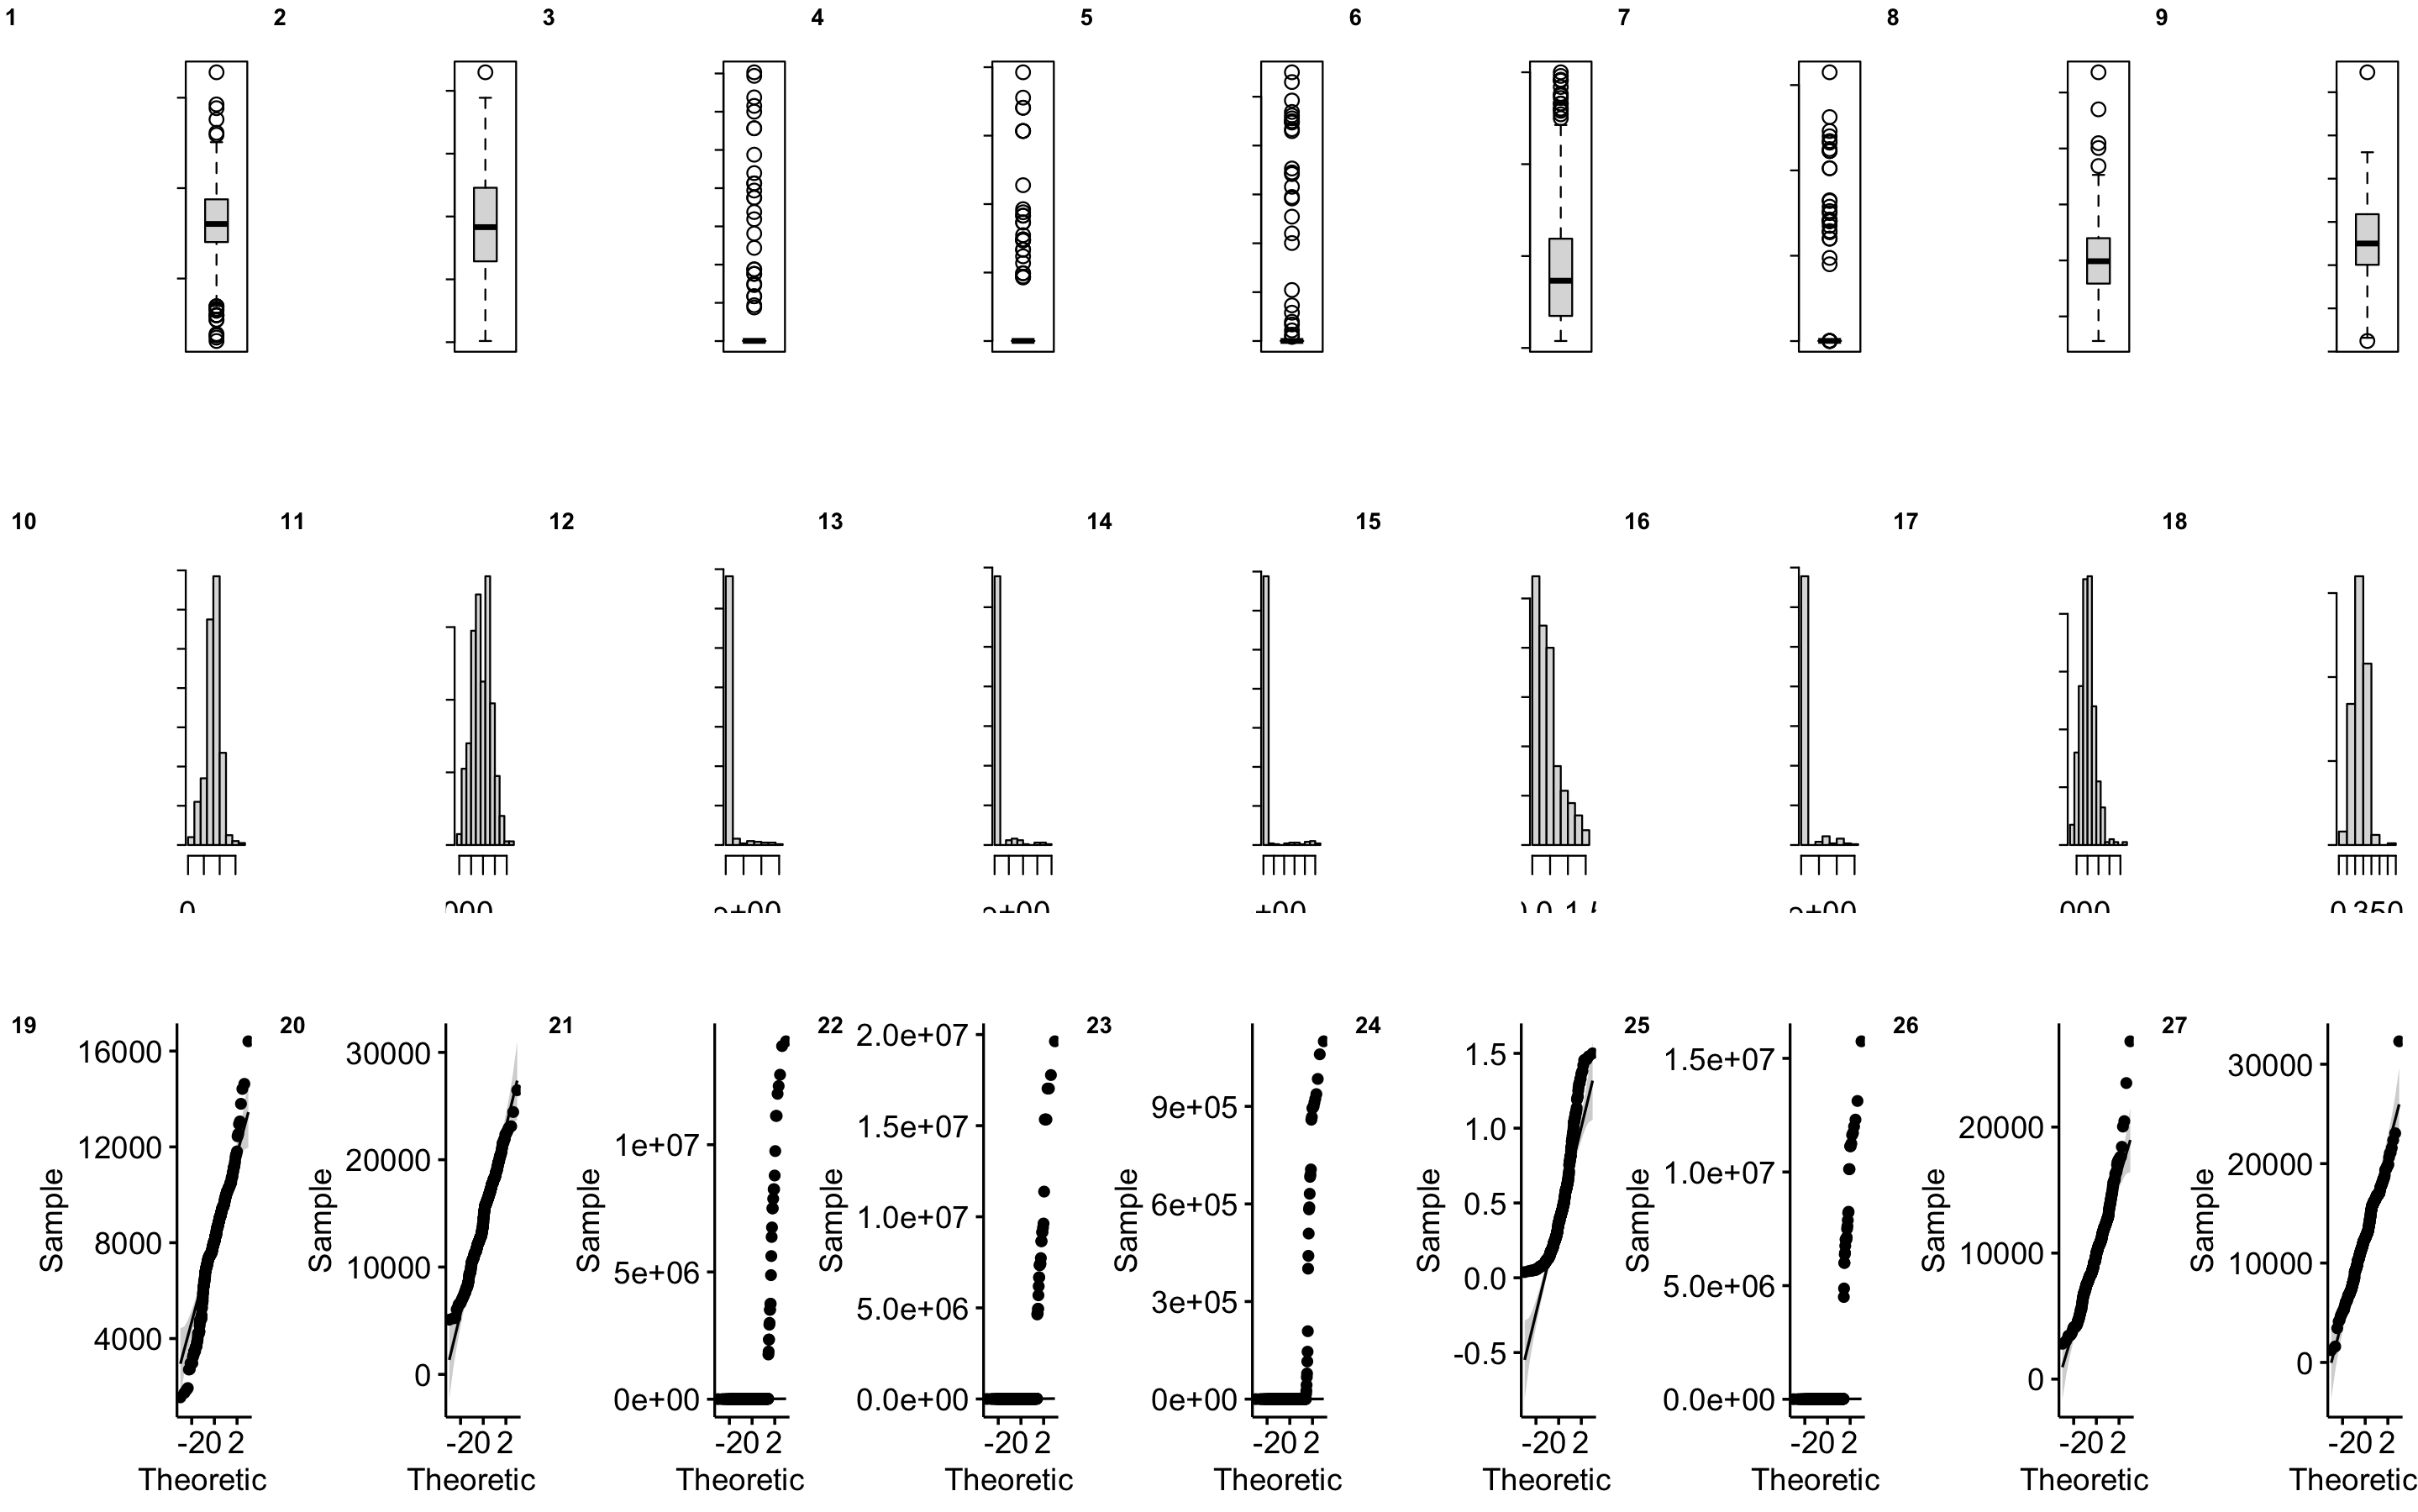
若要使用plot_grid()函数将hist()和boxplot()等基本对象转换为ggplot对象以进行排列,可以使用函数as.ggplot()。
#Box plots
Low_Freq_Box<-as.ggplot(~boxplot(New_Acoustic_Parameters$Low.Freq))
High_Freq_Box<-as.ggplot(~boxplot(New_Acoustic_Parameters$High.Freq))
Peak_Freq_Box<-as.ggplot(~boxplot(New_Acoustic_Parameters$Peak.Freq))
Delta_Freq_Box<-as.ggplot(~boxplot(New_Acoustic_Parameters$Delta.Freq))
Peak_Time_Box<-as.ggplot(~boxplot(New_Acoustic_Parameters$Peak.Time))
Delta_Time_Box<-as.ggplot(~boxplot(New_Acoustic_Parameters$Delta.Time))
Center_Freq_Box<-as.ggplot(~boxplot(New_Acoustic_Parameters$Center.Freq))
Start_Freq_Box<-as.ggplot(~boxplot(New_Acoustic_Parameters$Start.Freq))
End_Freq_Box<-as.ggplot(~boxplot(New_Acoustic_Parameters$End.Freq))

#Histograms
Low_Freq_hist<-as.ggplot(~hist(New_Acoustic_Parameters$Low.Freq))
High_Freq_hist<-as.ggplot(~hist(New_Acoustic_Parameters$High.Freq))
Peak_Freq_hist<-as.ggplot(~hist(New_Acoustic_Parameters$Peak.Freq))
Delta_Freq_hist<-as.ggplot(~hist(New_Acoustic_Parameters$Delta.Freq))
Peak_Time_hist<-as.ggplot(~hist(New_Acoustic_Parameters$Peak.Time))
Delta_Time_hist<-as.ggplot(~hist(New_Acoustic_Parameters$Delta.Time))
Center_Freq_hist<-as.ggplot(~hist(New_Acoustic_Parameters$Center.Freq))
Start_Freq_hist<-as.ggplot(~hist(New_Acoustic_Parameters$Start.Freq))
End_Freq_hist<-as.ggplot(~hist(New_Acoustic_Parameters$End.Freq))

#QQ Plots
Low_Freq_qqplot<-ggqqplot(New_Acoustic_Parameters$Low.Freq)
High_Freq_qqplot<-ggqqplot(New_Acoustic_Parameters$High.Freq)
Peak_Freq_qqplot<-ggqqplot(New_Acoustic_Parameters$Peak.Freq)
Delta_Freq_qqplot<-ggqqplot(New_Acoustic_Parameters$Delta.Freq)
Delta_Time_qqplot<-ggqqplot(New_Acoustic_Parameters$Peak.Time)
Peak_Time_qqplot<-ggqqplot(New_Acoustic_Parameters$Delta.Time)
Center_Freq_qqplot<-ggqqplot(New_Acoustic_Parameters$Center.Freq)
Start_Freq_qqplot<-ggqqplot(New_Acoustic_Parameters$Start.Freq)
End_Freq_qqplot<-ggqqplot(New_Acoustic_Parameters$End.Freq)

#Open a new graphics window
dev.new()

#Plot the box plots, histograms, and qqplots on the same grid
plot_grid(Low_Freq_Box, High_Freq_Box, Peak_Freq_Box, Delta_Freq_Box, Peak_Time_Box, Delta_Time_Box, Center_Freq_Box, Start_Freq_Box, End_Freq_Box,
          Low_Freq_hist, High_Freq_hist, Peak_Freq_hist, Delta_Freq_hist, Peak_Time_hist, Delta_Time_hist, Center_Freq_hist, Start_Freq_hist, End_Freq_hist,
          Low_Freq_qqplot, High_Freq_qqplot, Peak_Freq_qqplot, Delta_Freq_qqplot, Delta_Time_qqplot, Peak_Time_qqplot, Center_Freq_qqplot, Start_Freq_qqplot, End_Freq_qqplot,
          labels=c("1", "2", "3", "4", "5", "6", "7", "8", "9", "10", "11", "12", "13", "14", "15", "16", "17", "18", "19", "20", "21", "22", "23", "24", "25", "26", "27"),
          ncol=9, nrow=3,
          align="hv",
          label_size = 9,
          axis = "tblr")
图:
Stack Overflow用户
发布于 2022-05-18 12:29:56
您试过使用grid.arrange()包的gridExtra函数吗?
有一个例子在这里的克朗
对你来说会是这样
library(gridExtra)
library(grid)
library(ggplot2)

grid.arrange(Low_Freq_Box, High_Freq_Box, Peak_Freq_Box, Delta_Freq_Box, Peak_Time_Box, Delta_Time_Box, Center_Freq_Box, Start_Freq_Box, End_Freq_Box,
          Low_Freq_hist, High_Freq_hist, Peak_Freq_hist, Delta_Freq_hist, Peak_Time_hist, Delta_Time_hist, Center_Freq_hist, Start_Freq_hist, End_Freq_hist,
Low_Freq_qqplot, High_Freq_qqplot, Peak_Freq_qqplot, Delta_Freq_qqplot, Delta_Time_qqplot, Peak_Time_qqplot, Center_Freq_qqplot, Start_Freq_qqplot, End_Freq_qqplot)页面原文内容由Stack Overflow提供。腾讯云小微IT领域专用引擎提供翻译支持
原文链接:
https://stackoverflow.com/questions/72289038
复制相关文章
相似问题
腾讯云开发者
