
如何为混合模型绘制森林地块
如何制作混合模型的森林样地及其置信区间。我试过这段代码
Model = lme (fixed = score~ Age+Sex+yearsofeducation+walkspeed,
random = ~1|ID,
data=DB,
na.action = na.omit, method = "ML",
)
plot_summs (model)
然而,我希望森林地块中的OR以递减的方式排序。谢谢你的帮助。
回答 2
Stack Overflow用户
发布于 2022-06-06 02:02:38
我只是在Bolker的最佳答案中再添加一个选项:using the modelsummary package. (免责声明:我是作者)。
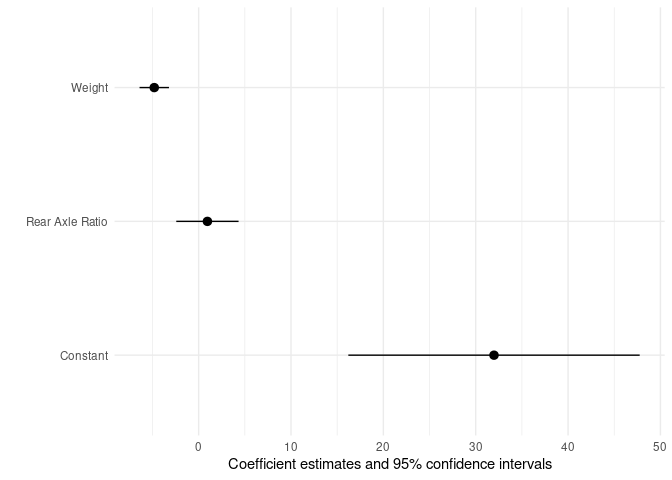
使用该包,可以使用modelplot()函数创建林图,并使用coef_map参数重命名和重新排序系数。如果您正在估计logit模型,并希望获得赔率比,则可以使用exponentiate参数。
在coef_map向量中插入系数的顺序,从下到上,在绘图中对它们进行排序。例如:
library(lme4)
library(modelsummary)

mod <- lmer(mpg ~ wt + drat + (1 | gear), data = mtcars)

modelplot(
    mod,
    coef_map = c("(Intercept)" = "Constant",
                 "drat" = "Rear Axle Ratio",
                 "wt" = "Weight"))
Stack Overflow用户
发布于 2022-06-06 01:31:46
我称之为“系数图”,而不是“森林图”。(当您比较许多不同研究的相同效果的估计值时,在元分析中使用森林地块。)
示例设置
这是一个有点愚蠢的例子,但应该足够接近你的(我不清楚你为什么提到OR (=比数比?),这些通常是逻辑回归的结果.?)
library(nlme)
mtcars <- transform(mtcars, cylgear = interaction(cyl, gear))
m1 <- lme(mpg ~ disp + hp + drat + wt + qsec,
    random = ~1|cylgear,
    data = mtcars)
系数图:斑点须
您可以直接从dotwhisker包中获得您想要的内容,但是它不会对效果进行排序(据我所知,也不容易):
library(dotwhisker)
library(broom.mixed)  ## required to 'tidy' (process) lme fits
dwplot(m1, effects = "fixed")
系数图:潮汐图
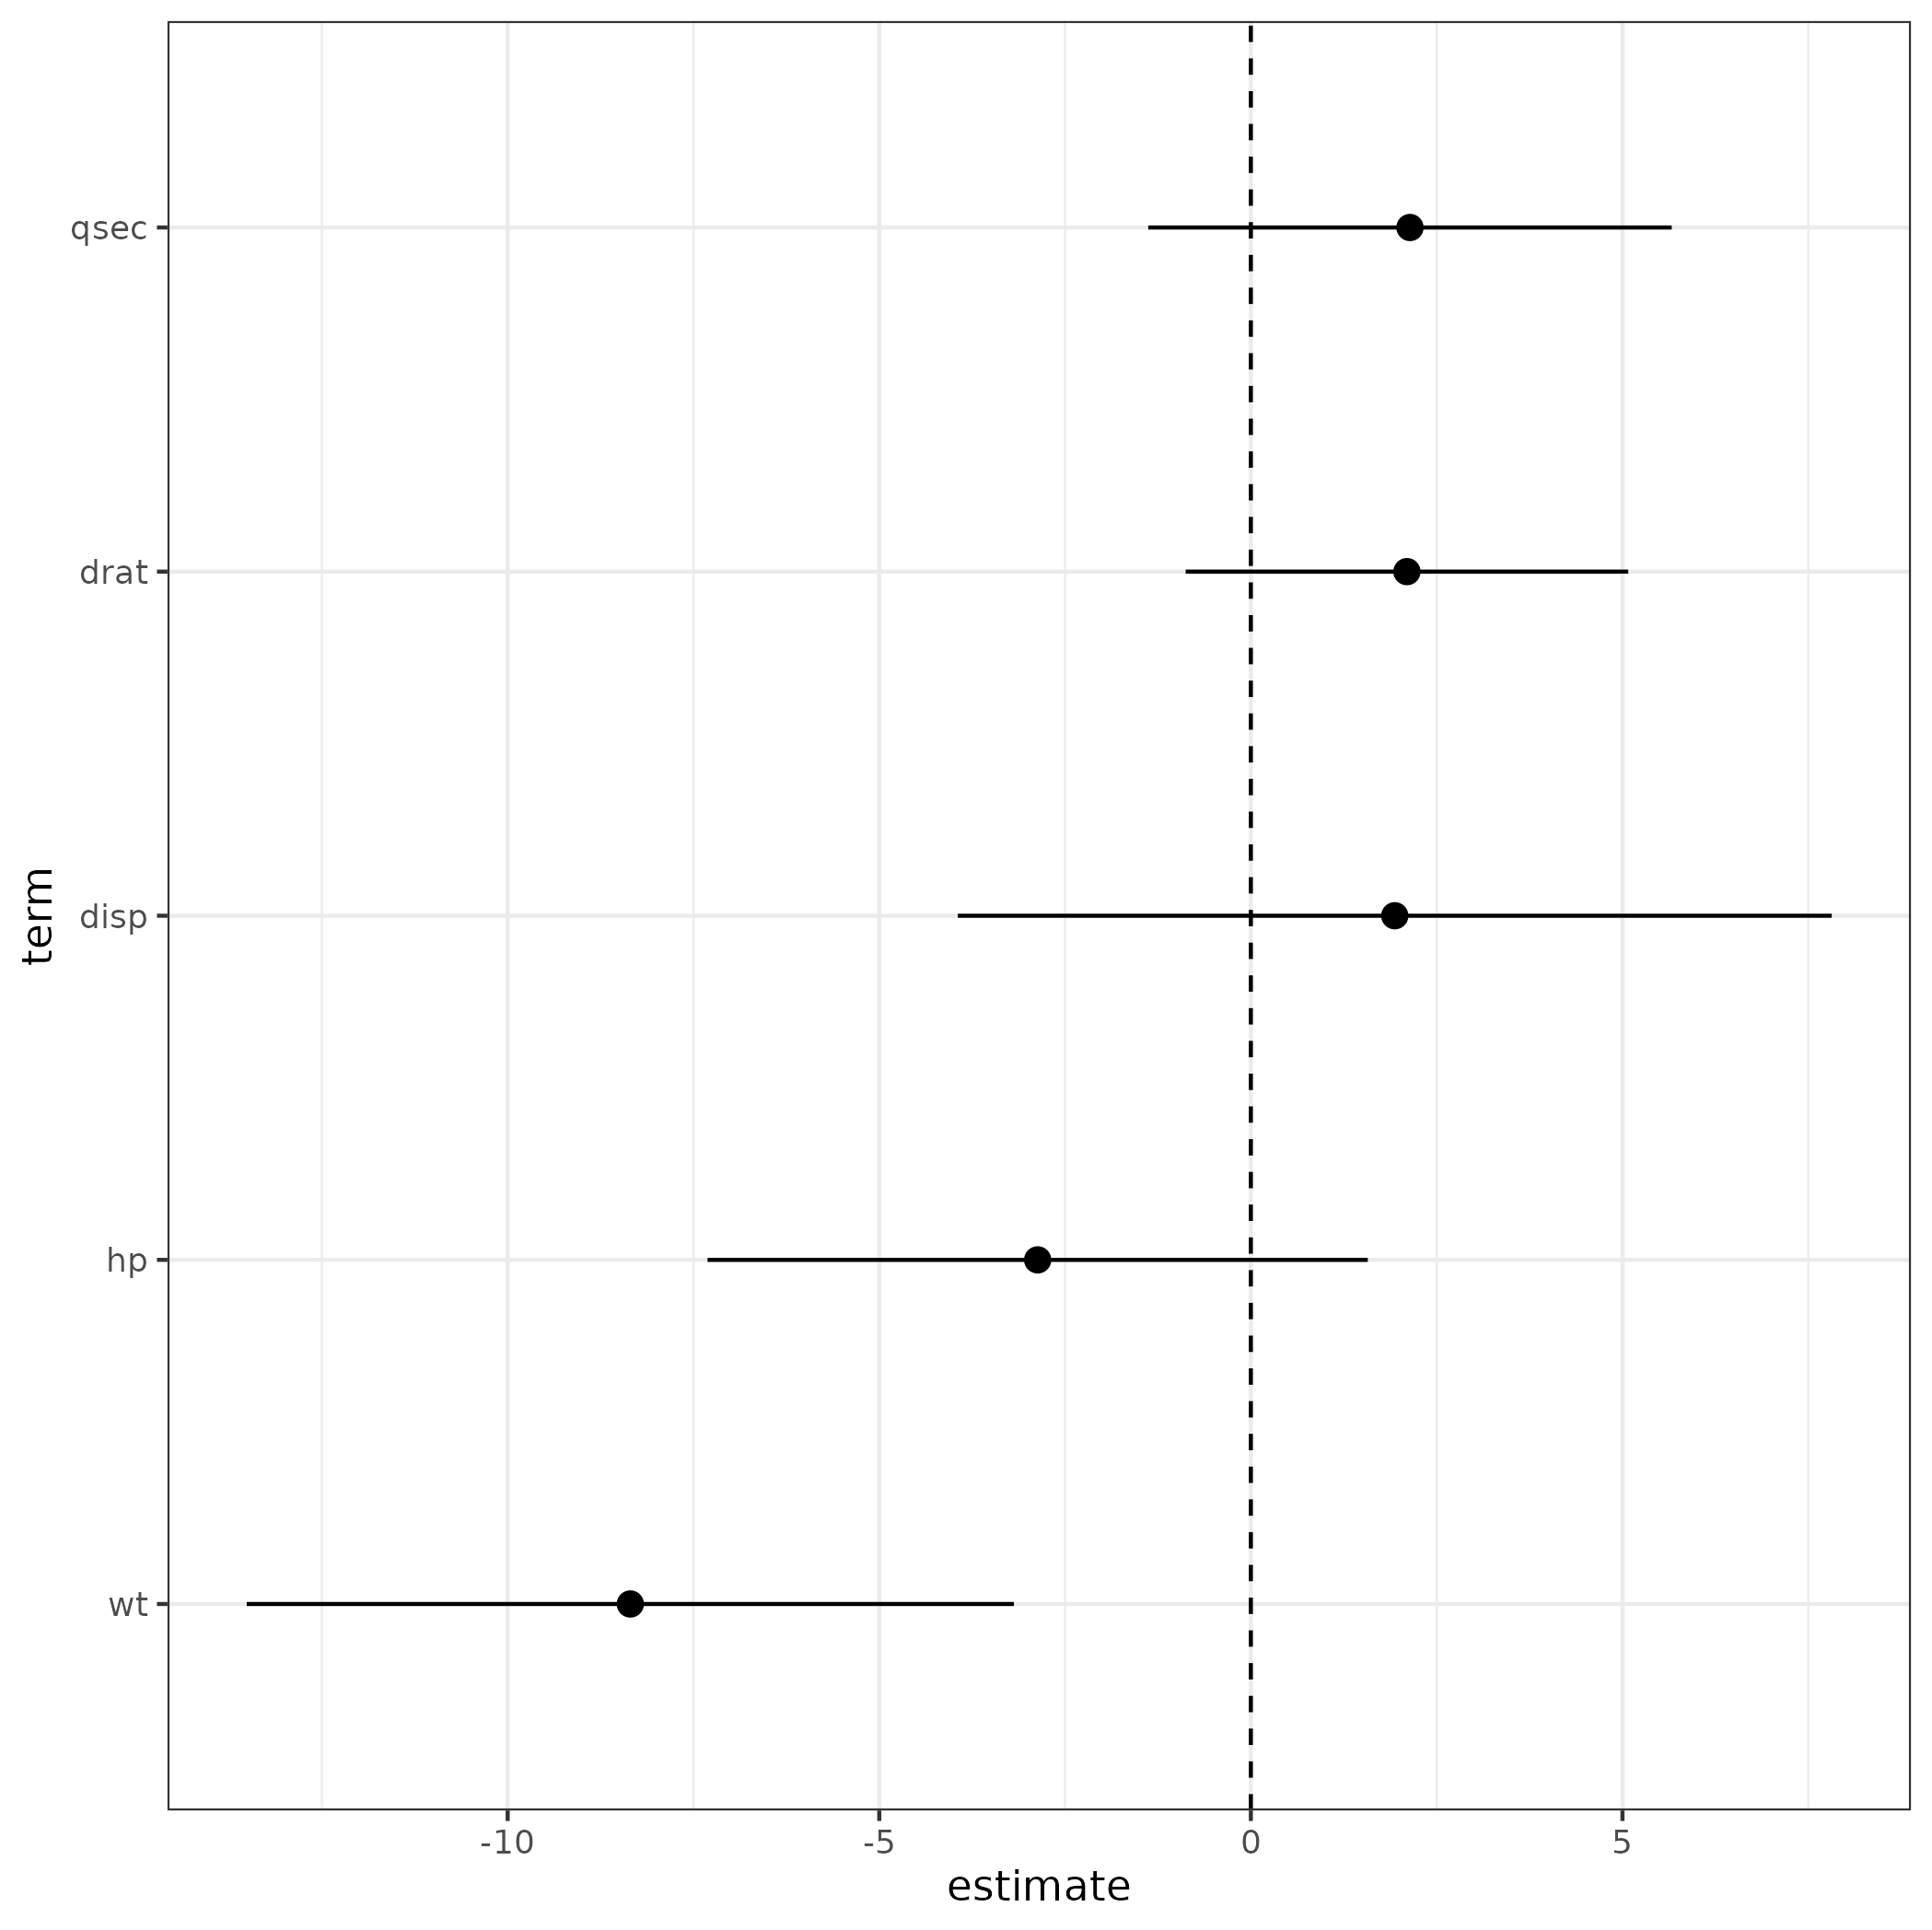
我通常自己处理,因为我更喜欢增加灵活性。
library(tidyverse)
tt <- (m1
    ## extract estimates and CIs
    |> tidy(effects = "fixed", conf.int = TRUE)
    ## usually *don't* want to compare intercept (dwplot does this automatically)
    |> filter(term != "(Intercept)")
    ## scale parameters by 2SD - usually necessary for comparison
    |> dotwhisker::by_2sd(data = mtcars)
    ## take only the bits we need, rename some (cosmetic)
    |> select(term, estimate, lwr = conf.low, upr = conf.high)
    ## order terms by estimate value
    |> mutate(across(term, ~reorder(factor(.), estimate)))
)

gg0 <- (ggplot(tt,
               aes(estimate, term))
    + geom_pointrange(aes(xmin = lwr, xmax = upr))
    + geom_vline(xintercept = 0, lty = 2)
)
print(gg0)
这里唯一剩下的/可能的棘手问题是,如果你有类似大小的正系数和负系数,该怎么办。如果您想按绝对值排序,那么
|> mutate(across(term, ~reorder(factor(.), estimate,
 FUN = function(x) mean(abs(x)))
虽然这有点难看。
如果你喜欢的话,你可以用forcats::fct_reorder来代替reorder。
https://stackoverflow.com/questions/72509941
复制相似问题
腾讯云开发者

Copyright © 2013 - 2026 Tencent Cloud. All Rights Reserved. 腾讯云 版权所有
深圳市腾讯计算机系统有限公司 ICP备案/许可证号:粤B2-20090059 ![]() 粤公网安备44030502008569号
粤公网安备44030502008569号
腾讯云计算(北京)有限责任公司 京ICP证150476号 | 京ICP备11018762号