用Cartopy和Geopandas覆盖形状文件外的掩模区域
我有一套我用Cartopy绘制的数据(龙,拉特,温度)。我可以给出的最小示例是下面的代码(只有30个数据点)。
import cartopy.crs as ccrs
import cartopy.feature as cfeature
import matplotlib.pyplot as plt
import matplotlib.colors as clr
import pandas as pd
import numpy as np

from metpy.interpolate import interpolate_to_grid, remove_nan_observations
from cartopy.io.shapereader import Reader
from cartopy.feature import ShapelyFeature

canada_east = -95
canada_west = -101.8
canada_north = 52.8
canada_south = 48.85

central_lon = (canada_east + canada_west)/2
central_lat = (canada_north + canada_south)/2

crs = ccrs.LambertConformal(central_longitude = central_lon, central_latitude = central_lat)
lat = np.array([49.8134 50.904  50.698  49.095  49.436  49.9607 49.9601 49.356  50.116
49.402  52.3472 50.411  49.24   49.876  49.591  49.905  49.498  49.088
49.118  50.5947 49.3776 49.148  49.1631 51.358  49.826  50.4324 49.96
49.68   49.875  50.829  51.572])
lon = np.array([-100.3721  -97.273   -99.068   -97.528  -100.308   -98.9054  -98.6367
-99.248   -96.434  -100.93   -101.1099 -100.893  -100.055   -99.909
-97.518   -99.354   -98.03    -99.325   -99.054   -98.0035 -100.5387
-100.491   -97.1454 -100.361   -96.776   -99.4392  -97.7463  -97.984
-95.92    -98.111  -100.488])
tem = np.array([-8.45   -4.026  -5.993  -3.68   -7.35   -7.421  -6.477  -8.03   -3.834
-13.04   -4.057  -8.79   -6.619 -10.89   -4.465  -8.41   -4.861  -9.93
-7.125  -4.424 -11.95   -9.56   -3.86   -7.17   -4.193  -7.653  -4.883
-5.631  -3.004  -4.738  -8.81])

xp, yp, _ = crs.transform_points(ccrs.PlateCarree(), lon, lat ).T
xp, yp, tem = remove_nan_observations(xp, yp, tem)

alt_x, alt_y, data = interpolate_to_grid( xp, yp, tem, minimum_neighbors=2, search_radius=240000, interp_type = 'barnes', hres = 1000)

# Create the figure and grid for subplots
fig = plt.figure(figsize=(17, 12))

# Main ax
ax = plt.subplot(111, projection=crs)
ax.set_extent([canada_west, canada_east, canada_south, canada_north], ccrs.PlateCarree())

# Ading province borders and country borders
provinces_bdr = cfeature.NaturalEarthFeature(category = 'cultural',
                                                name = 'admin_1_states_provinces_lines',
                                                scale = '50m',
                                                linewidth = 0.6,
                                                facecolor='none',
                                                )  # variable to add provinces border

country_bdr = cfeature.NaturalEarthFeature(category= 'cultural',
                                            name = 'admin_0_boundary_lines_land',
                                            scale = '50m',
                                            linewidth = 1.5,
                                            facecolor = 'none',
                                            edgecolor = 'k')

ax.add_feature(provinces_bdr, linestyle='--')
ax.add_feature(country_bdr, linestyle='--')

ax.add_feature(cfeature.LAND)
ax.add_feature(cfeature.OCEAN)
ax.add_feature(cfeature.BORDERS)

cf = ax.pcolormesh(alt_x, alt_y, data, cmap=plt.cm.rainbow)

# Read the shape file and add it

shape_feature = ShapelyFeature(Reader('MB_AGregion_Perim_South.shp').geometries(), ccrs.epsg(26914), linewidth = 1, facecolor = (1, 1, 1, 0), edgecolor = (0.5, 0.5, 0.5, 1))

ax.add_feature(shape_feature)
plt.show()
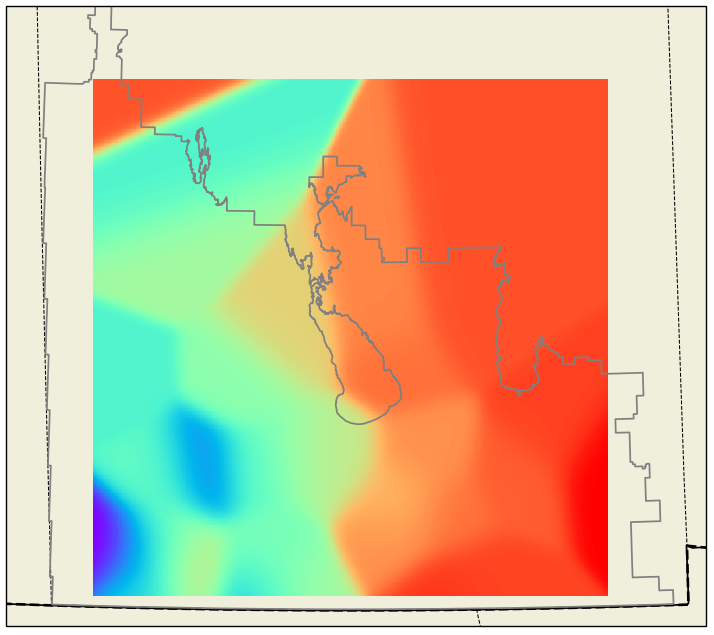
由此得出的结果是:

里面的灰色线是由形状文件生成的。现在,我想将着色限制为只在形状文件中(在灰色线之外的区域不应该用pcolormesh着色),但是我找不到工作的方法。我读过this example和this example,但我不能同时理解它们。是否有一个简单的方法来做到这一点,单独使用地质公园和/或卡拉托?
对不起,我不能上传这里的形状文件,这是我能做的最好的最起码的例子。如果我应该做什么改进,请告诉我。我对堆叠溢出很陌生,也很容易受到批评。
Edit1:为了澄清,我想要限制颜色的形状文件是我用ShapelyFeature (代码的最后4行)读取的'MB_AGregion_Perim_South.shp‘,它画出了我的大部分着色范围的灰色线。
编辑2:正如@Michael建议的那样,我添加了以下代码行:
cat_gdf = geopandas.read_file('MB_AGregion_Perim_South.shp')
cat_gdf = cat_gdf.to_crs(epsg = 4326)
mask = shapely.vectorized.contains(cat_gdf.dissolve().geometry.item(), alt_x, alt_y)
其中alt_x和alt_y是内插结果(请看上面的示例)。形状文件最初有epsg = 26914,所以我将其转换为4326。
问题是掩码包含所有的假值(这意味着它掩盖了一切)。我怀疑这是因为alt_x和alt_y是用crs.transform_points(ccrs.PlateCarree()、lon、lat ).T转换的坐标(正如我上面的代码所示)。我到处搜索,尝试将形状文件放入不同的epsg值,但它不起作用。另外,cat_gdf.geometry是一个多多边形。会不会是这里的原因?
对于将来正在为这一问题奋斗的人来说,here是对该解决方案的详细解释
回答 1
Stack Overflow用户
发布于 2022-06-08 04:39:17
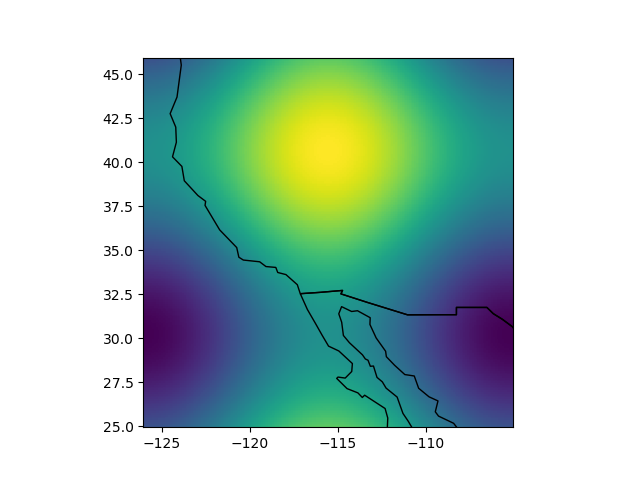
快速MRE:
import numpy as np, pandas as pd, geopandas as gpd
import matplotlib.pyplot as plt

x = np.arange(-126, -105, 0.1)
y = np.arange(25, 46, 0.1)
xx, yy = np.meshgrid(x, y)
xnorm = (xx - xx.min()) / (xx.max() - xx.min())
ynorm = (yy - yy.min()) / (yy.max() - yy.min())
v = np.cos((xnorm * 2 - 1) * np.pi) + np.sin((ynorm * 2 - 1) * np.pi)

gdf = gpd.read_file(gpd.datasets.get_path('naturalearth_lowres'))

fig, ax = plt.subplots()
ax.pcolormesh(xx, yy, v)
xlim, ylim = ax.get_xlim(), ax.get_ylim()
gdf.plot(ax=ax, color='none', edgecolor='k')
ax.set_xlim(*xlim)
ax.set_ylim(*ylim)

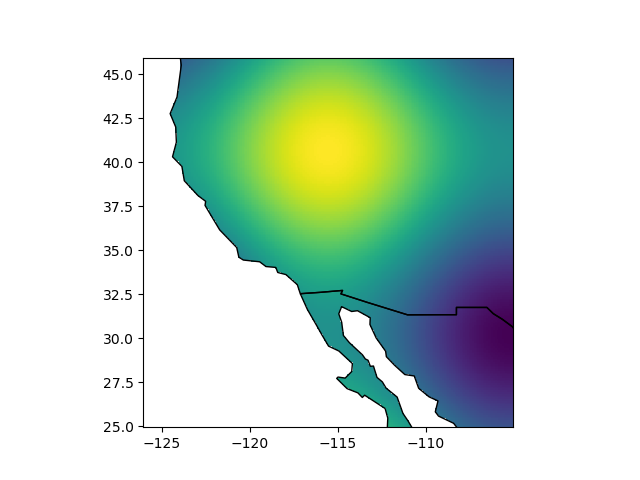
您可以使用shapely.vectorized来屏蔽一组x,y点,使用shapely.geometry对象:
import shapely.vectorized
mask = shapely.vectorized.contains(gdf.dissolve().geometry.item(), xx, yy)

fig, ax = plt.subplots()
ax.pcolormesh(xx, yy, np.where(mask, v, np.nan))
xlim, ylim = ax.get_xlim(), ax.get_ylim()
gdf.plot(ax=ax, color='none', edgecolor='k')
ax.set_xlim(*xlim)
ax.set_ylim(*ylim)

https://stackoverflow.com/questions/72534885
复制相似问题

