
交互式查看器vscode中的python绘图图
交互式查看器vscode中的python绘图图
提问于 2022-06-07 18:39:00
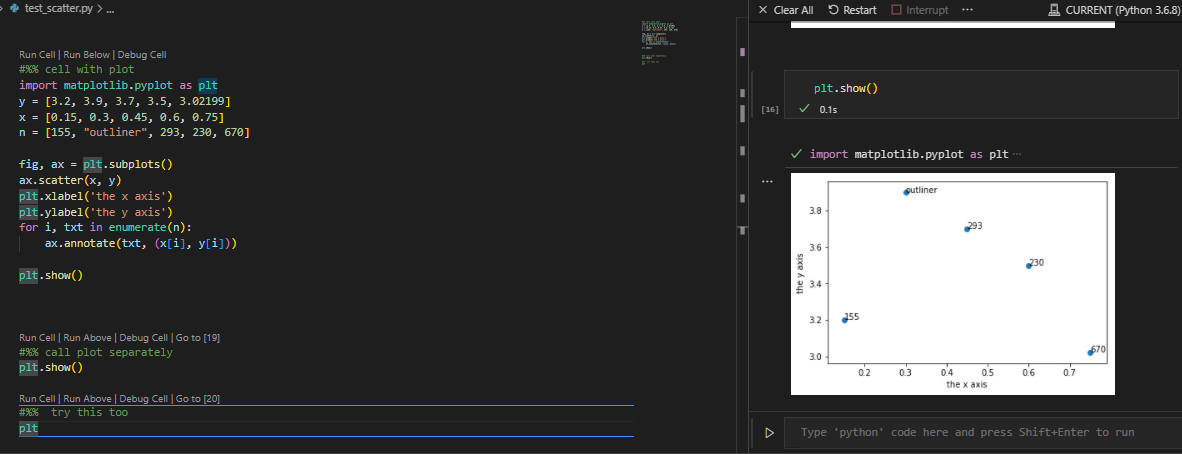
这在vscode中工作并显示了一个图
#%% cell with plot
import matplotlib.pyplot as plt
y = [3.2, 3.9, 3.7, 3.5, 3.02199]
x = [0.15, 0.3, 0.45, 0.6, 0.75]
n = [155, "outliner", 293, 230, 670]

fig, ax = plt.subplots()
ax.scatter(x, y)
plt.xlabel('the x axis')
plt.ylabel('the y axis')
for i, txt in enumerate(n):
    ax.annotate(txt, (x[i], y[i]))

plt.show()
这是一张图片:
然而,这是行不通的:
#%% call plot separately
plt.show()
这也不是:
#%%  try this too
plt
因此,既然地块存在于第一个单元格中(因为它可以被看到),为什么不能在其他单元格中调用或看到它,或者如何才能做到这一点?
Stack Overflow用户
发布于 2022-06-07 19:55:18
尝试:
1.调用plt.ion()而不是plt.show()
2.在plt.show()之前添加%matplotlib inline
3.卸载matplotlib并使用apt-get代替pip重新安装
4.或安装此模块apt-get install python3-tk
页面原文内容由Stack Overflow提供。腾讯云小微IT领域专用引擎提供翻译支持
原文链接:
https://stackoverflow.com/questions/72536100
复制相关文章
相似问题
腾讯云开发者

Copyright © 2013 - 2026 Tencent Cloud. All Rights Reserved. 腾讯云 版权所有
深圳市腾讯计算机系统有限公司 ICP备案/许可证号:粤B2-20090059 ![]() 粤公网安备44030502008569号
粤公网安备44030502008569号
腾讯云计算(北京)有限责任公司 京ICP证150476号 | 京ICP备11018762号