
是否有一种方法可以删除最新版本的streamlit中包含文件名的侧导航栏?
是否有一种方法可以删除最新版本的streamlit中包含文件名的侧导航栏?
提问于 2022-06-08 09:57:00
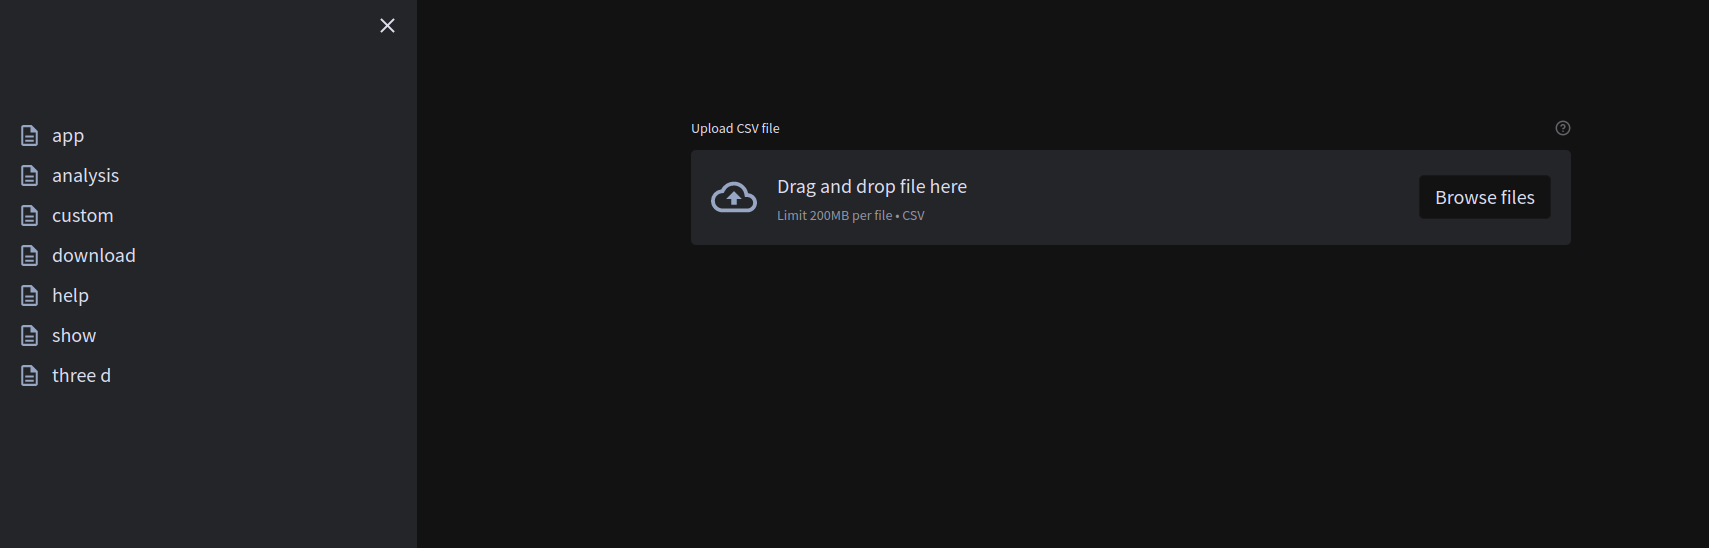
我最近将streamlit升级到了1.10.0版本。升级之后,我运行了streamlit,结果发现在我的目录中有一个显示python文件名的侧导航栏。我也附上了同样的图片。
import streamlit as st
import pandas as pd
from services.multiapp import MultiApp
from functools import partial
from pages import show, analysis, help, custom, download, three_d


def refresh():
    pass


file = st.file_uploader('Upload CSV file',
                        type='csv', help="Format")
if file is not None:
    # verification
    # Prediction
    st.button("Refresh", on_click=refresh)
    data = pd.read_csv(file)
    app = MultiApp()
    app.add_app('Show data', partial(show.app, data))
    app.add_app('Analysis', analysis.app)
    app.add_app('Custom Plots', custom.app)
    app.add_app('3-D Plots', partial(three_d.app, data))
    app.add_app('Download', partial(download.app, data, file.name))
    app.add_app('Help', help.app)
    app.run()
请帮我移除侧导航栏。
我的当前工作目录有以下结构
├── app.py
├── pages
│   ├── analysis.py
│   ├── custom.py
│   ├── download.py
│   ├── help.py
│   ├── __pycache__
│   │   ├── analysis.cpython-38.pyc
│   │   ├── analysis.cpython-39.pyc
│   │   ├── custom.cpython-38.pyc
│   │   ├── custom.cpython-39.pyc
│   │   ├── download.cpython-38.pyc
│   │   ├── download.cpython-39.pyc
│   │   ├── get_df.cpython-38.pyc
│   │   ├── help.cpython-38.pyc
│   │   ├── help.cpython-39.pyc
│   │   ├── iplots.cpython-38.pyc
│   │   ├── plot.cpython-38.pyc
│   │   ├── show.cpython-38.pyc
│   │   ├── show.cpython-39.pyc
│   │   ├── show_d.cpython-38.pyc
│   │   ├── three_d.cpython-38.pyc
│   │   └── three_d.cpython-39.pyc
│   ├── show.py
│   └── three_d.py
├── __pycache__
│   ├── multiapp.cpython-38.pyc
│   └── plots.cpython-38.pyc
├── README.md
├── services
│   ├── multiapp.py
│   ├── __pycache__
│   │   ├── multiapp.cpython-38.pyc
│   │   └── multiapp.cpython-39.pyc
│   └── services.py
├── Templates
│   ├── links.txt
│   ├── multi-page-app-main
│   │   ├── app.py
│   │   ├── apps
│   │   │   ├── data.py
│   │   │   ├── home.py
│   │   │   ├── model.py
│   │   │   └── __pycache__
│   │   │       ├── data.cpython-38.pyc
│   │   │       ├── home.cpython-38.pyc
│   │   │       └── model.cpython-38.pyc
│   │   ├── multiapp.py
│   │   ├── __pycache__
│   │   │   └── multiapp.cpython-38.pyc
│   │   ├── README.md
│   │   └── requirements.txt
│   ├── streamlit-dashboard-template-main
│   │   ├── app.py
│   │   ├── dashboard.py
│   │   ├── README.md
│   │   ├── stdashdark.png
│   │   └── stdashlight.png
│   ├── streamlit-geospatial-master
│   │   ├── app.py
│   │   ├── apps
│   │   │   ├── basemaps.py
│   │   │   ├── census.py
│   │   │   ├── cesium.py
│   │   │   ├── deck.py
│   │   │   ├── device_loc.py
│   │   │   ├── gee_datasets.py
│   │   │   ├── gee.py
│   │   │   ├── heatmap.py
│   │   │   ├── home.py
│   │   │   ├── housing.py
│   │   │   ├── plotly_maps.py
│   │   │   ├── raster.py
│   │   │   ├── rois.py
│   │   │   ├── timelapse.py
│   │   │   ├── vector.py
│   │   │   ├── wms.py
│   │   │   └── xy.py
│   │   ├── data
│   │   │   ├── cog_files.txt
│   │   │   ├── html
│   │   │   │   └── sfo_buildings.html
│   │   │   ├── realtor_data_dict.csv
│   │   │   ├── us_counties.geojson
│   │   │   ├── us_metro_areas.geojson
│   │   │   ├── us_nation.geojson
│   │   │   └── us_states.geojson
│   │   ├── environment-bk.yml
│   │   ├── index.html
│   │   ├── LICENSE
│   │   ├── multiapp.py
│   │   ├── packages.txt
│   │   ├── Procfile
│   │   ├── README.md
│   │   ├── requirements.txt
│   │   └── setup.sh
│   ├── Streamlit-master
│   │   ├── app.py
│   │   ├── data
│   │   │   ├── demo.wav
│   │   │   ├── Salary_Data.csv
│   │   │   ├── sal.jpg
│   │   │   ├── snippets
│   │   │   └── virtual.mp4
│   │   ├── data.py
│   │   ├── demo.py
│   │   ├── layout.py
│   │   ├── plots.py
│   │   ├── Procfile
│   │   ├── README.md
│   │   ├── requirements.txt
│   │   ├── sidebar.py
│   │   └── widget.py
│   └── streamlit template
│       ├── JC-202103-citibike-tripdata.csv
│       ├── logo.png
│       ├── requirements.txt
│       └── streamlit_template.py
├── test.csv
└── test.py页面原文内容由Stack Overflow提供。腾讯云小微IT领域专用引擎提供翻译支持
原文链接:
https://stackoverflow.com/questions/72543675
复制相关文章
相似问题
腾讯云开发者

Copyright © 2013 - 2026 Tencent Cloud. All Rights Reserved. 腾讯云 版权所有
深圳市腾讯计算机系统有限公司 ICP备案/许可证号:粤B2-20090059 ![]() 粤公网安备44030502008569号
粤公网安备44030502008569号
腾讯云计算(北京)有限责任公司 京ICP证150476号 | 京ICP备11018762号