
SwiftUI图表:如何覆盖多个图形数据?
SwiftUI图表:如何覆盖多个图形数据?
提问于 2022-06-12 01:27:54
这是两个图表。我想把object和object2的数据放在一个图表中。
有可能吗?
Chart(db.objects, id: \.self) { object in
    LineMark(
        x: .value("name", object.name),
        y: .value("value", Int(object.value) ?? 0)
    )
}

Chart(db.objects2, id: \.self) { object2 in
    LineMark(
        x: .value("name", object2.name),
        y: .value("value", Int(object2.value) ?? 0)
    )
}回答 3
Stack Overflow用户
发布于 2022-06-12 01:34:46
我刚从苹果开发者网站上找到了一条路
https://developer.apple.com/documentation/charts/chart/
struct ProfitOverTime {
var date: Date
var profit: Double
}
let departmentAProfit: [ProfitOverTime] = [] // ...
let departmentBProfit: [ProfitOverTime] = [] // ...
var body: some View {
Chart {
ForEach(departmentAProfit) {
LineMark(
x: .value("Date", $0.date),
y: .value("Profit A", $0.profit)
)
.foregroundStyle(.blue)
}
ForEach(departmentBProfit) {
LineMark(
x: .value("Date", $0.date),
y: .value("Profit B", $0.profit)
)
.foregroundStyle(.green)
}
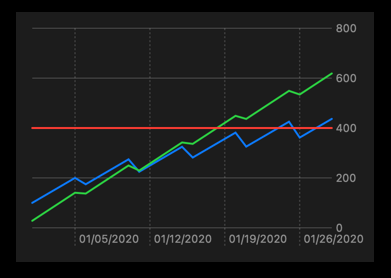
RuleMark(
y: .value("Threshold", 500.0)
)
.foregroundStyle(.red)
}
}
Stack Overflow用户
发布于 2022-06-13 04:08:19
这是另一种解决办法。由于数据结构是相同的,所以数据可以是一个源,并使用一个LineMark显示。
例如,向模型中添加了dept,以标识图表中表示一行的每一组数据:
    struct ProfitOverTime {
        var dept: String
        var date: Date
        var profit: Double
    }
将数据组合成一个数组:
let data: [ProfitOverTime] = [] // ...前台样式基于部门,即图表中的每一行。
struct DepartmentChart: View {
    var body: some View {
        Chart(data) {
            LineMark(
                x: .value("Date", $0.date),
                y: .value("Profit", $0.profit)
                series: .value("Department", $0.dept)
            )
            .foregroundStyle(by: .value("Department", $0.dept))

            RuleMark(
                y: .value("Threshold", 500.0)
            )
            .foregroundStyle(.red)
        }
        .chartForegroundStyleScale(["Profit A": .green, "Profit B": .blue])
    }
}
添加了序列,以根据其颜色识别每一行:

chartForegroundStyleScale是可选的,因为每一行将自动以不同的颜色显示。但是chartForegroundStyleScale可以用于自定义线条颜色。
Stack Overflow用户
发布于 2022-06-13 05:04:22
这里我展示了一个星期的数据。因此,如果您想要显示的不仅仅是数据,那么您可以增加条目的数量。所以这就是我希望你明白的。
现在像这样使用MultiLineChartView。
完整代码:
import SwiftUI
import Charts

struct ContentView: View {
    let days = ["S", "M", "T", "W", "T", "F", "S"]
    let entries1 = [
        ChartDataEntry(x: 1, y: 1),
        ChartDataEntry(x: 2, y: 2),
        ChartDataEntry(x: 3, y: 0),
        ChartDataEntry(x: 4, y: 0),
        ChartDataEntry(x: 5, y: 0),
        ChartDataEntry(x: 6, y: 0),
        ChartDataEntry(x: 7, y: 1),

    ]
    let entries2 = [
        ChartDataEntry(x: 1, y: 2),
        ChartDataEntry(x: 2, y: 3),
        ChartDataEntry(x: 3, y: 0),
        ChartDataEntry(x: 4, y: 0),
        ChartDataEntry(x: 5, y: 0),
        ChartDataEntry(x: 6, y: 0),
        ChartDataEntry(x: 7, y: 2)
    ]
    var body: some View {
        VStack{
            Spacer()
            MultiLineChartView(entries1: entries1, entries2: entries2, days: days)
            .frame(height: 220)
            Spacer()
        }
    }
}

struct MultiLineChartView : UIViewRepresentable {

    var entries1 : [ChartDataEntry]
    var entries2 : [ChartDataEntry]
    var days: [String]

    func makeUIView(context: Context) -> LineChartView {
        let chart = LineChartView()
        return createChart(chart: chart)
    }

    func updateUIView(_ uiView: LineChartView, context: Context) {
        uiView.data = addData()
    }

    func createChart(chart: LineChartView) -> LineChartView{
        chart.chartDescription?.enabled = false
        chart.xAxis.drawGridLinesEnabled = false
        chart.xAxis.drawLabelsEnabled = true
        chart.xAxis.drawAxisLineEnabled = false
        chart.xAxis.labelPosition = .bottom
        chart.rightAxis.enabled = false
        chart.leftAxis.enabled = false
        chart.drawBordersEnabled = false
        chart.legend.form = .none
        chart.xAxis.labelCount = 7
        chart.xAxis.forceLabelsEnabled = true
        chart.xAxis.granularityEnabled = true
        chart.xAxis.granularity = 1
        chart.xAxis.valueFormatter = CustomChartFormatter(days: days)

        chart.data = addData()
        return chart
    }

    func addData() -> LineChartData{
        let data = LineChartData(dataSets: [
            //Schedule Trips Line
            generateLineChartDataSet(dataSetEntries: entries1, color: UIColor(Color(#colorLiteral(red: 0.6235294118, green: 0.7333333333, blue: 0.3568627451, alpha: 1))), fillColor: UIColor(Color(#colorLiteral(red: 0, green: 0.8134518862, blue: 0.9959517121, alpha: 1)))),
            //Unloadings Line
            generateLineChartDataSet(dataSetEntries: entries2, color: UIColor(Color(#colorLiteral(red: 0.003921568627, green: 0.231372549, blue: 0.431372549, alpha: 1))), fillColor: UIColor(Color(#colorLiteral(red: 0.4745098054, green: 0.8392156959, blue: 0.9764705896, alpha: 1))))
        ])
        return data
    }

    func generateLineChartDataSet(dataSetEntries: [ChartDataEntry], color: UIColor, fillColor: UIColor) -> LineChartDataSet{
        let dataSet = LineChartDataSet(entries: dataSetEntries, label: "")
        dataSet.colors = [color]
        dataSet.mode = .cubicBezier
        dataSet.circleRadius = 5
        dataSet.circleHoleColor = UIColor(Color(#colorLiteral(red: 0.003921568627, green: 0.231372549, blue: 0.431372549, alpha: 1)))
        dataSet.fill = Fill.fillWithColor(fillColor)
        dataSet.drawFilledEnabled = true
        dataSet.setCircleColor(UIColor.clear)
        dataSet.lineWidth = 2
        dataSet.valueTextColor = color
        dataSet.valueFont = UIFont(name: "Avenir", size: 12)!
        return dataSet
    }

}

class CustomChartFormatter: NSObject, IAxisValueFormatter {
    var days: [String]

    init(days: [String]) {
        self.days = days
    }

    public func stringForValue(_ value: Double, axis: AxisBase?) -> String {
        return days[Int(value-1)]
    }
}页面原文内容由Stack Overflow提供。腾讯云小微IT领域专用引擎提供翻译支持
原文链接:
https://stackoverflow.com/questions/72588917
复制相关文章
相似问题
腾讯云开发者
