
如何在Python中的图像区域上生成直方图?(在用openCV确定轮廓之后)
如何在Python中的图像区域上生成直方图?(在用openCV确定轮廓之后)
提问于 2022-06-14 10:24:56
我对Python没有任何经验,但我需要将它用作我的项目的数据处理步骤。我正在研究葡萄园的无人机热图像,目标是根据海拔和温度将冠层像素和地面像素分开。使用数字高程模型( DEM ),首先对冠层和地面进行了区分。这导致了一个二元掩模层,可以放在葡萄园的热图像之上。这样,我现在有了一个Python的热图像,其中大部分地面像素是0,而冠层像素的值在0到65535之间,表示温度。然而,由于第一个区分(使用DEM)不够精确,一些地面像素也包括在遮罩罩中。
现在,我想用选定区域的温度进行第二次区分。我能够用opencv制作所有冠层区域的轮廓(所以我有一个代表树冠区域的所有轮廓的完整列表-有一些地面像素)。我的目标是使每个轮廓区域的直方图显示该区域内每个像素值的密度。希望我能删除太热的像素(也就是背景像素)。
有人知道如何为图像的每一个(填充)轮廓生成直方图吗?现在的格式是6082x4922 ndarray,其值介于数据类型uint16的0到65535之间。我使用PyCharm作为IDE。
提前感谢!
回答 1
Stack Overflow用户
回答已采纳
发布于 2022-06-14 12:11:30
方法:
- 迭代掩码中的每个等高线
- 查找掩码
- 中的像素位置,在给定的图像
- 计算中找到它们的对应值,并绘制直方图
<代码>F 211
代码:
# reading given image in grayscale
img = cv2.imread('apples.jpg', 0)

# reading the mask in grayscale
img_mask = cv2.imread(r'apples_mask.jpg', 0)
# binarizing the mask
mask = cv2.threshold(img_mask,0,255,cv2.THRESH_BINARY+cv2.THRESH_OTSU)[1]
# find contours on the mask
contours, hierarchy = cv2.findContours(mask, cv2.RETR_EXTERNAL, cv2.CHAIN_APPROX_NONE)

# the approach is encoded within this loop
for i, c in enumerate(contours):
    # create a blank image of same shape
    black = np.full(shape = im.shape, fill_value = 0, dtype = np.uint8)
    # draw a single contour as a mask
    single_object_mask = cv2.drawContours(black,[c],0,255, -1)
    # coordinates containing white pixels of mask
    coords = np.where(single_object_mask == 255)
    # pixel intensities present within the image at these locations
    pixels = img[coords]
    # plot histogram
    plt.hist(pixels,256,[0,256])
    plt.savefig('apples_histogram_{}.jpg'.format(i)')
    # to avoid plotting in the same plot
    plt.clf()
结果:(以下为3个直方图图)
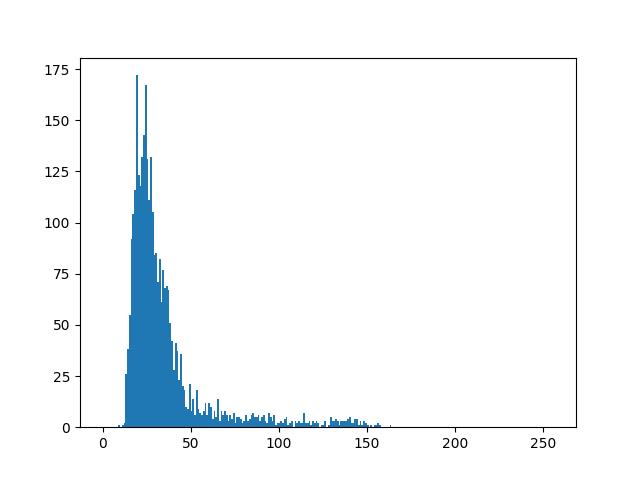
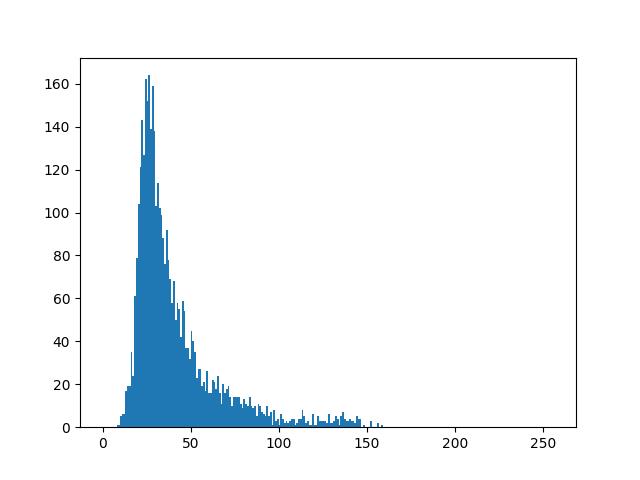
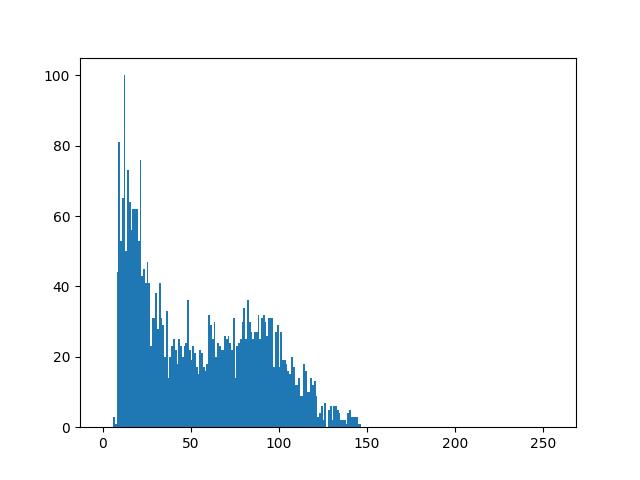
如果删除
plt.clf(),则所有直方图都将绘制在一幅图上。
您可以为用例扩展相同的方法。
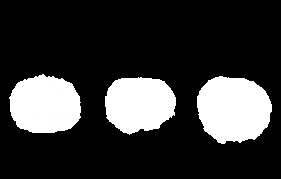
原始图像:

页面原文内容由Stack Overflow提供。腾讯云小微IT领域专用引擎提供翻译支持
原文链接:
https://stackoverflow.com/questions/72615332
复制相关文章
相似问题
腾讯云开发者
