
图层图像与实时更新热图
图层图像与实时更新热图
提问于 2022-06-20 10:26:33
我有:
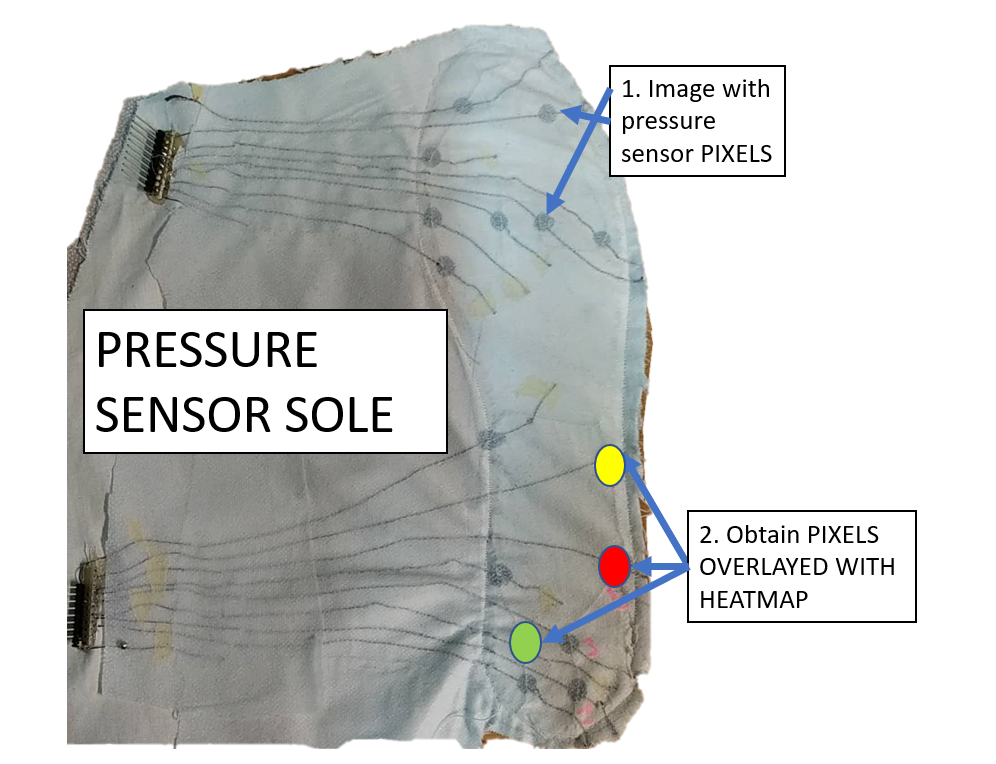
一个带有16个压力传感器的鞋垫的图像。sensor
- Pressure值的
- A 2*8的压力值阵列每0.1s
实时更新一次。
我想:
每个压力传感器(黑点)在绘图applied
- update
- 叠加的背景下,每0.1s
显示压力
- 压力值的热图值。
下面的代码确实用背景图像覆盖了更新的热图,但是我不知道如何重新定位热图以覆盖传感器(黑点)。
import matplotlib.pyplot as plt
import numpy as np
import time
#Trial combining heatmap + backgoround image
fig = plt.figure()
ax = fig.add_subplot(111)
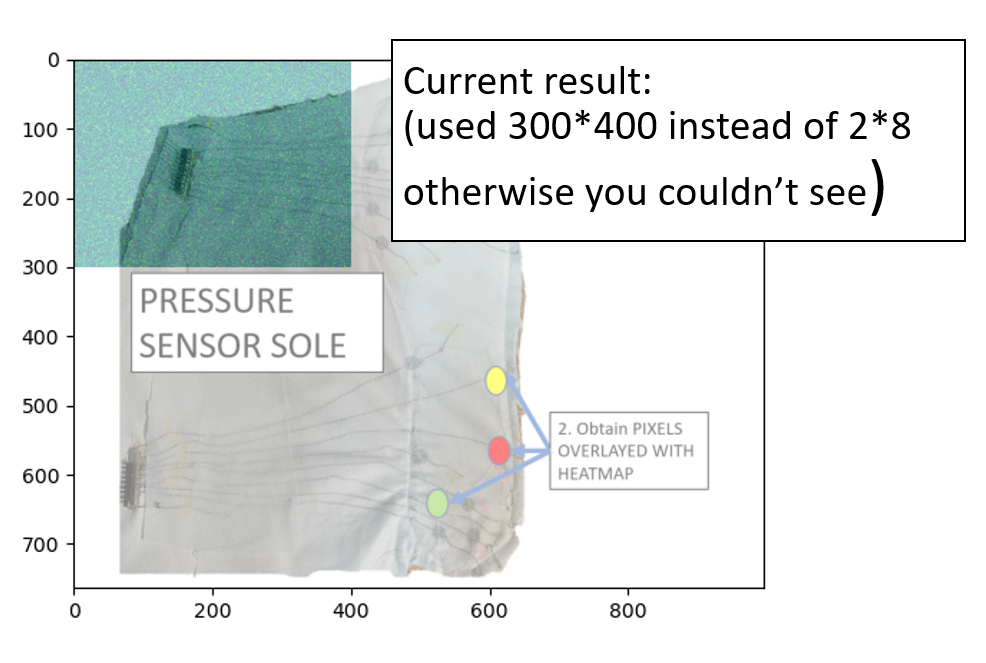
im = ax.imshow(np.random.random((300,400))) # Usually 2*8 but cannot see it
img = plt.imread(r"..\Desktop\Example_image.PNG")
ax.imshow(img, alpha=0.5)
plt.show(block=False)
# draw some data in loop
for i in range(100):
# wait for a second
time.sleep(0.1)
# PRESSURE SENSOR VALUES USUALLY 2*8, USING 300*400 SO THEY ARE VISIBLE
Pressue_values = np.random.random((300,400))
im.set_array(Pressue_values)
# redraw the figure
fig.canvas.draw()
fig.canvas.flush_events()如何将2*8压力值映射到正确的压力传感器像素?
当前的结果示例-像素太小,需要映射到正确的位置并扩展到相邻的位置。
回答 1
Stack Overflow用户
回答已采纳
发布于 2022-06-22 18:45:41
此代码使用散点图在压力传感器上绘制圆圈,并根据输入数据更新颜色。您应该更新SENSOR_MIN和SENSOR_MAX以匹配您的传感器(这样可以防止当输入发生变化时色阶发生变化)。
import sys
import time
import matplotlib.pyplot as plt
import numpy as np

# min and max values that the sensors will produce
SENSOR_MIN = 0
SENSOR_MAX = 1

def make_plot(background, coordinates, pressure_data):
    fig, ax = plt.subplots(1, 1)
    ax.imshow(background)

    coordinates = np.asarray(coordinates).reshape(-1, 2).T
    sc = ax.scatter(
        *coordinates,
        s=10.0**2,
        c=pressure_data.reshape(-1),
        cmap="viridis",
        vmin=SENSOR_MIN,
        vmax=SENSOR_MAX,
    )
    fig.colorbar(sc, label="pressure (some units)")
    return fig, sc

def update_plot(fig, sc, pressure_data):
    """Update the plot with new data and redraw the figure."""
    sc.set_array(pressure_data.reshape(-1))
    fig.canvas.draw()
    fig.canvas.flush_events()

def get_data():
    return np.random.random((2, 8))

if __name__ == "__main__":
    background_img = plt.imread("Example_image.PNG")
    # pixel coordinates of each sensor in the background image
    coords = [[[462, 106],
               [547, 113],
               [430, 156],
               [601, 237],
               [543, 222],
               [497, 221],
               [430, 216],
               [444, 266]],
              [[489, 439],
               [609, 463],
               [613, 564],
               [500, 574],
               [568, 641],
               [524, 643],
               [577, 688],
               [527, 683]]]

    fig, sc = make_plot(background_img, coords, get_data())
    # exit the script when the figure is closed
    fig.canvas.mpl_connect("close_event", lambda event: sys.exit())
    plt.show(block=False)

    # draw some data in loop
    while True:
        frame_start = time.perf_counter()
        pressure_values = get_data()
        # update the figure
        update_plot(fig, sc, pressure_values)
        # wait for 0.1s (including the time it took to update the plot)
        frame_time = time.perf_counter() - frame_start
        if frame_time < 0.1:
plt.pause(0.1 - frame_time)页面原文内容由Stack Overflow提供。腾讯云小微IT领域专用引擎提供翻译支持
原文链接:
https://stackoverflow.com/questions/72685638
复制相关文章
相似问题
腾讯云开发者
