
Python,Matplotlib;绘制部分圆
Python,Matplotlib;绘制部分圆
提问于 2022-06-29 07:39:10
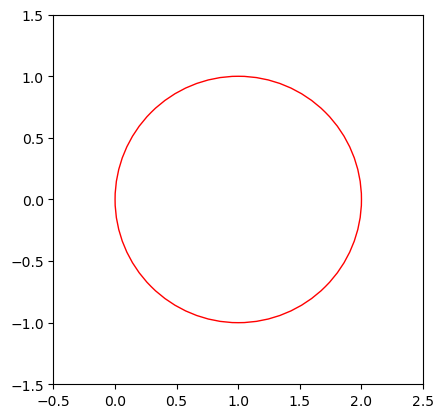
我可以这样画一个完整的圆圈:
plt.figure()
ax = plt.gca()

# Make the circle patch and add to the figure
circle = plt.Circle((1, 0), 1, color='r', fill=None)
ax.add_patch(circle)

# Make it a perfect circle by making it a perfect square box
ax.set_aspect('equal', adjustable='box')

# Set axis so it's visible
plt.xlim([-0.5,2.5])
plt.ylim([-1.5, 1.5])
到目前一切尚好。但是,我只想要一个圆圈的一部分?比如,像这样的东西。
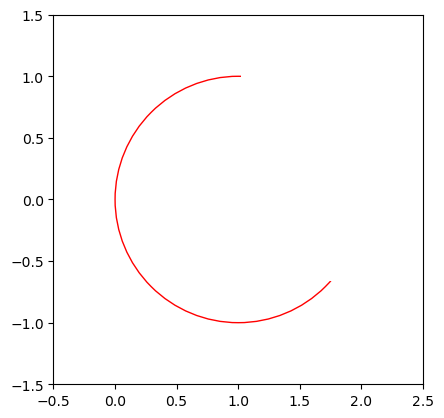
我可以用与背景颜色相同的plot something on top来表示,但这似乎有点麻烦。有更好的办法吗?
回答 1
Stack Overflow用户
回答已采纳
发布于 2022-06-29 07:45:00
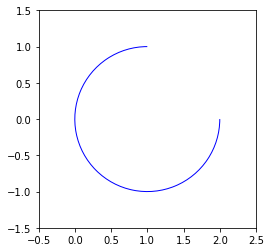
使用Arc怎么样?
from matplotlib.patches import Arc
radius = 1
arc = Arc((1, 0), radius*2, radius*2, color='b', theta1=90, theta2=360)
ax.add_patch(arc)
产出:
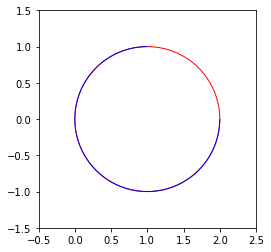
在原始圆圈顶部的输出:
页面原文内容由Stack Overflow提供。腾讯云小微IT领域专用引擎提供翻译支持
原文链接:
https://stackoverflow.com/questions/72797530
复制相关文章
相似问题
腾讯云开发者
