
ValueError: X和y不能大于2-D,但具有形状(2,)和(2,1,991)
ValueError: X和y不能大于2-D,但具有形状(2,)和(2,1,991)
提问于 2022-07-06 13:26:57
我想绘制我的数据,但我得到了这个错误。你知道我该怎么做吗?
fig, ax = plt.subplots(figsize=(12,8))

ax.plot(wl, dat[:], color='black')

ax.plot(wl2, dat2[:], color='green')


ax.axvline(4861.32,color='b', linewidth=1)

ax.text(4861.32 + 0.2, np.mean(dat) + 4.8*np.std(dat), "H"+ r'$\beta$', fontsize = 10, color = 'b')

ax.set_title('Spectra', fontsize = 15)

ax.set_xlabel(r'Wavelength [$\mathrm{\AA}$]',fontsize=15)

ax.set_ylabel(r'Flux [erg/cm2/cm/A]', fontsize = 15)
ax.set_xlim(3700,5000)

ax.set_ylim([np.mean(dat2) - 1.5*np.std(dat2), np.mean(dat2) + 2*np.std(dat2)])
回溯
---------------------------------------------------------------------------
ValueError                                Traceback (most recent call last)
Input In [81], in <cell line: 5>()
      1 fig, ax = plt.subplots(figsize=(12,8))
      3 ax.plot(wl, dat[:], color='black')
----> 5 ax.plot(wl2, dat2[:], color='green')

File ~\anaconda3\envs\py10\lib\site-packages\matplotlib\axes\_axes.py:1632, in Axes.plot(self, scalex, scaley, data, *args, **kwargs)
   1390 """
   1391 Plot y versus x as lines and/or markers.
   1392
   (...)
   1629 (``'green'``) or hex strings (``'#008000'``).
   1630 """
   1631 kwargs = cbook.normalize_kwargs(kwargs, mlines.Line2D)
-> 1632 lines = [*self._get_lines(*args, data=data, **kwargs)]
   1633 for line in lines:
   1634     self.add_line(line)

File ~\anaconda3\envs\py10\lib\site-packages\matplotlib\axes\_base.py:312, in _process_plot_var_args.__call__(self, data, *args, **kwargs)
    310     this += args[0],
    311     args = args[1:]
--> 312 yield from self._plot_args(this, kwargs)

File ~\anaconda3\envs\py10\lib\site-packages\matplotlib\axes\_base.py:501, in _process_plot_var_args._plot_args(self, tup, kwargs, return_kwargs)
    498     raise ValueError(f"x and y must have same first dimension, but "
    499                      f"have shapes {x.shape} and {y.shape}")
    500 if x.ndim > 2 or y.ndim > 2:
--> 501     raise ValueError(f"x and y can be no greater than 2D, but have "
    502                      f"shapes {x.shape} and {y.shape}")
    503 if x.ndim == 1:
    504     x = x[:, np.newaxis]

ValueError: x and y can be no greater than 2D, but have shapes (2,) and (2, 1, 991)回答 1
Stack Overflow用户
回答已采纳
发布于 2022-07-06 14:56:33
- 目前有4个数据数组,
wl、dat、wl2、dat2。 wl和wl2的形状如下。
import numpy as np

wl = wl2 = np.array([0, 1])

# wl and wl2 look essentially like this
array([0, 1])

>>> wl.shape
(2,)dat看起来本质上像wl和wl2,形状相同dat2看起来不一样,因为它是一个3D数组,而wl2的形状与dat2不匹配。
# sample data in the same shape as dat2
np.random.seed(2022)
dat2 = np.random.normal(4, 1, (2, 1, 991))

>>> dat2.shape
(2, 1, 991)

# dat2 looks like the following
array([[[3.9994721 , 3.72509858, 3.86071444, ..., 4.24822846,
         2.7409143 , 5.96405405]],

       [[3.54264793, 5.54945521, 5.68753333, ..., 5.88797684,
3.98211438, 5.69521236]]])dat2不能用wl2绘制,因为形状不匹配。dat2可以被切片(dat2[:, :, 0])以匹配wl2的形状,其中0是991对中的1对数字。
>>> dat2[:, :, 0]
array([[3.9994721 ],
       [3.54264793]])

>>> dat2[:, :, 0].shape
(2, 1) # which corresponds to (2,) and will plot without issue- 请参阅其他资源:
一些绘图选项
- 这不是一份详尽无遗的选项清单。
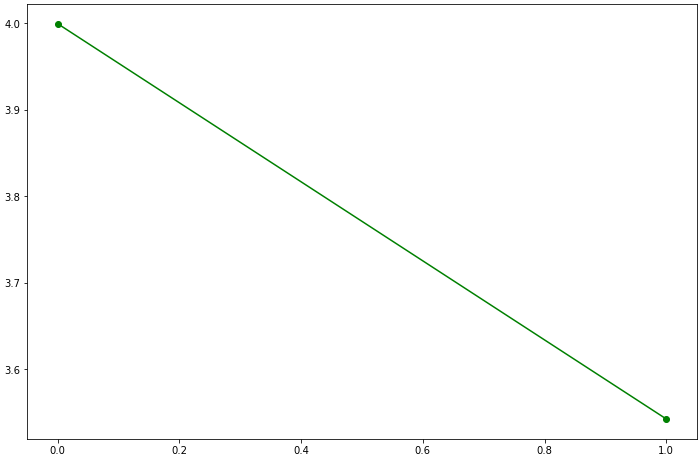
1.图1一对数字
import matplotlib.pyplot as plt

fig, ax = plt.subplots(figsize=(12,8))
ax.plot(wl2, dat2[:, :, 0], color='green', marker='o')
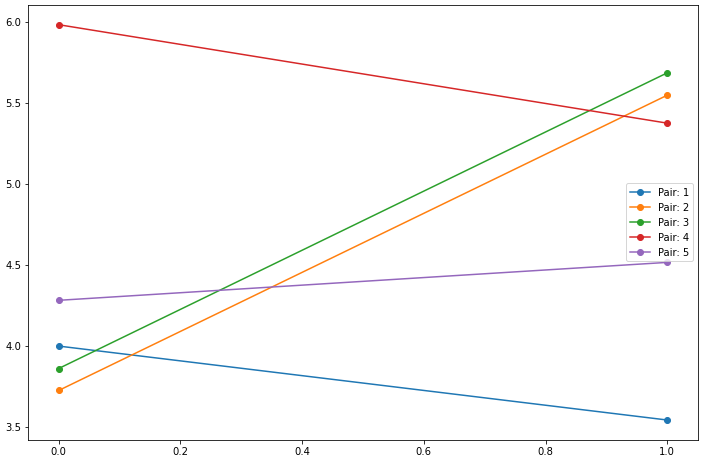
2.图5对( 991对中)
fig, ax = plt.subplots(figsize=(12,8))
for i, pair in enumerate(zip(*dat2[0, :, :5], *dat2[1, :, :5]), 1):
    ax.plot(wl2, pair, marker='o', label=f'Pair: {i}')
ax.legend()
plt.show()
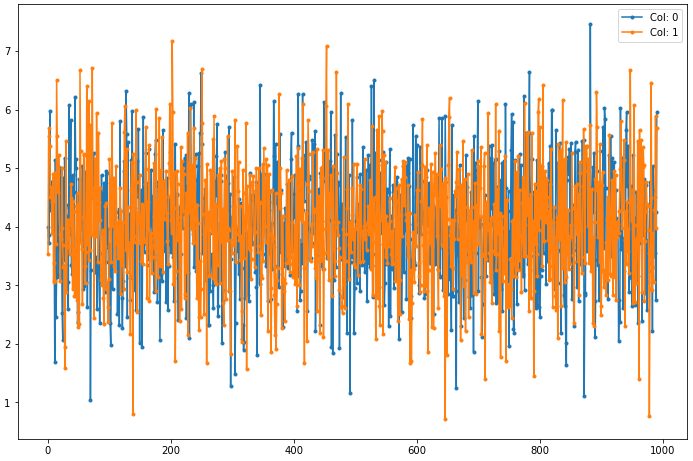
3.分出每组991人
- 这不是针对
wl2绘制的。
fig, ax = plt.subplots(figsize=(12, 8))
for i, col in enumerate(dat2):
    ax.plot(col.flat, marker='.', label=f'Col: {i}')
ax.legend()
plt.show()
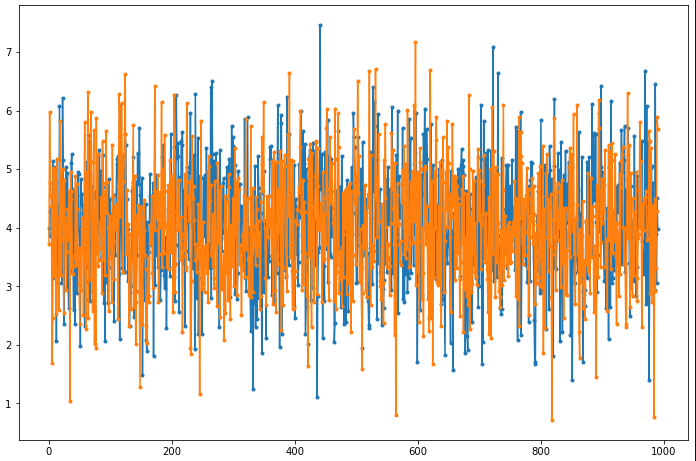
4.重塑dat3与地块
.reshape((991, 2))
- 重塑数组的图等价于选项3.。
# reshape the array
dat2l = dat2.reshape((991, 2))

>>> print(dat2l.shape)
(991, 2)

# plot
fig, ax = plt.subplots(figsize=(12, 8))
ax.plot(dat2l, marker='.')
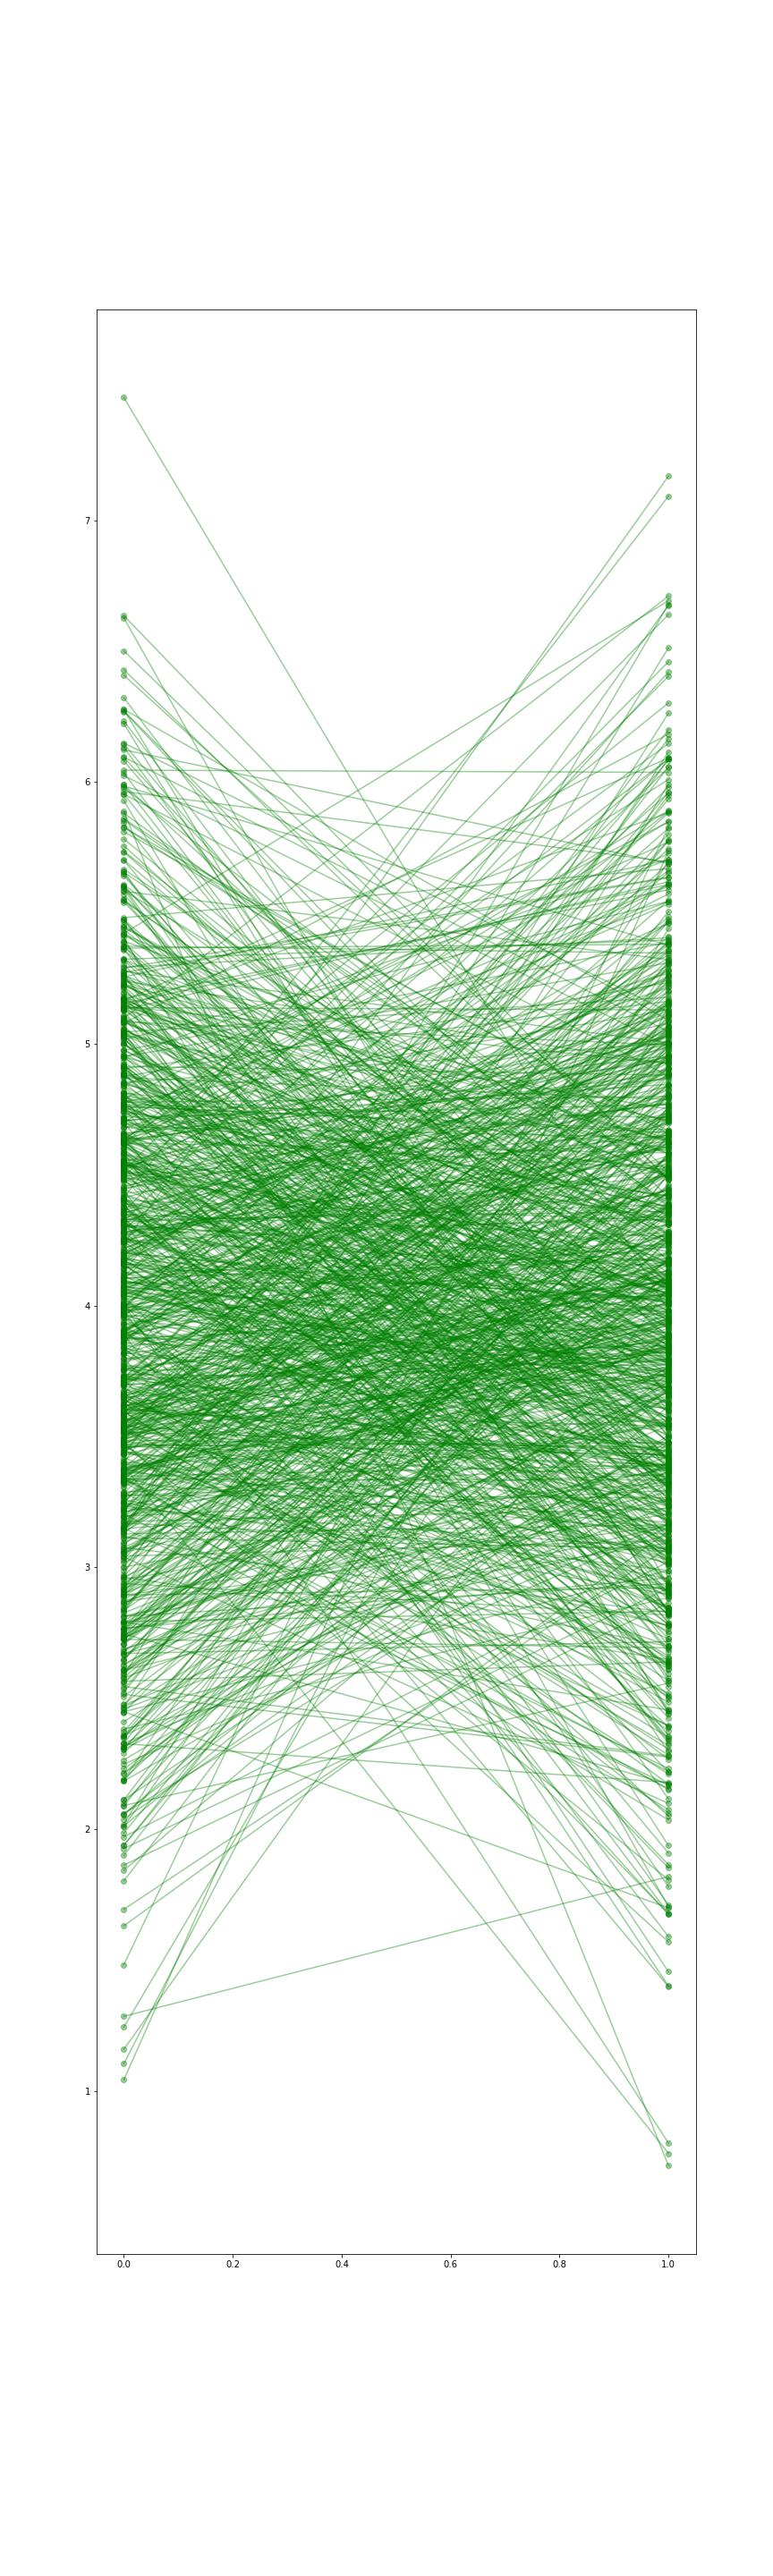
.reshape((2, 991))
- 重塑数组的图等价于选项2. 。
ax.plot(wl2, dat2r[:, :5], color='green', marker='o', alpha=0.4)会画出前5对。
# reshape the array
dat2r = dat2.reshape((2, 991))

>>> print(dat2r.shape)
(2, 991)

# plot
fig, ax = plt.subplots(figsize=(12, 40))
_ = ax.plot(wl2, dat2r, color='green', marker='o', alpha=0.4)
页面原文内容由Stack Overflow提供。腾讯云小微IT领域专用引擎提供翻译支持
原文链接:
https://stackoverflow.com/questions/72884399
复制相关文章
相似问题
腾讯云开发者
