
通过AmChart 4实现线性量规功能
通过AmChart 4实现线性量规功能
提问于 2022-07-06 20:17:58
我想用a 4来做一个像this one这样的图表。
链接的问题只支持AmCharts 3,而AmCharts 4没有.addGraph()功能。使用XYCharts()可以做到这一点吗?
const chart = new am4core.create(chartDiv.current, am4charts.XYChart);
chart.dataProvider = chartData;
chart.categoryField = 'category';
chart.rotate = true;
chart.columnWidth = 1;

// AXES
// Category
const categoryAxis = chart.xAxes.push(new am4charts.CategoryAxis());
categoryAxis.gridAlpha = 0;
categoryAxis.axisAlpha = 0;
categoryAxis.gridPosition = 'start';

// value
const valueAxis = chart.yAxes.push(new am4charts.ValueAxis());
valueAxis.stackType = '100%';
valueAxis.gridAlpha = 0;
valueAxis.autoGridCount = false;
valueAxis.gridCount = 20;
valueAxis.axisAlpha = 1;

// GRAPHS
// firstgraph
const graph = new am4charts.XYChart();
graph.labelText = 'Bad';
graph.valueField = 'bad';
graph.type = 'column';
graph.lineAlpha = 0;
graph.fillAlphas = 1;
graph.fillColors = ['#d05c4f', '#ffb2a8'];
chart.createChild(graph);我尝试了chart.createChild(),但这似乎适用于矩形这样的容器。如何使用AmCharts 4实现相同的功能?
回答 1
Stack Overflow用户
回答已采纳
发布于 2022-07-13 05:40:44
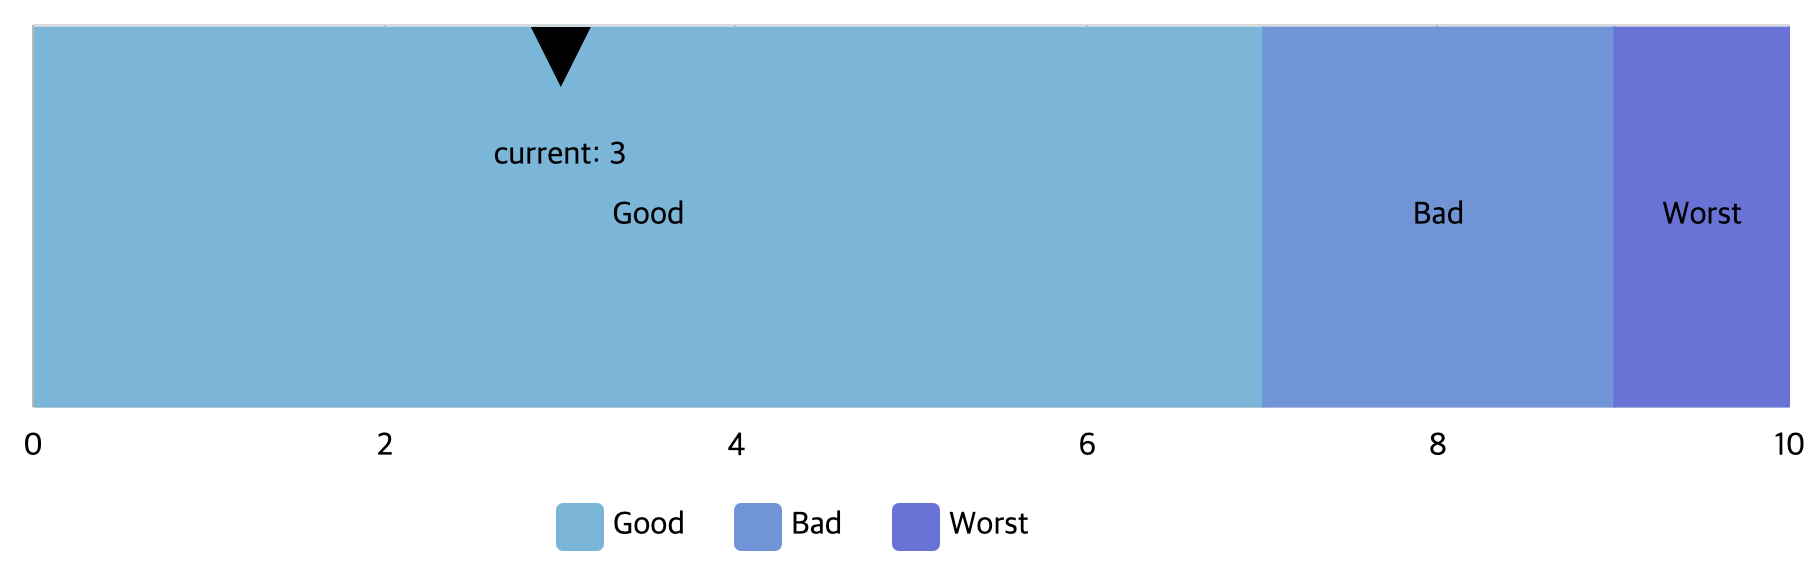
量规图本质上是由一种类型的系列数据组成的堆叠列(条形)图。我修改了堆叠列图,使之看起来像问题中关联的量规图。
工作演示:https://codepen.io/rabelais88/pen/RwMGxxJ
<script src="https://cdn.amcharts.com/lib/4/core.js"></script>
<script src="https://cdn.amcharts.com/lib/4/charts.js"></script>
<script src="https://cdn.amcharts.com/lib/4/themes/animated.js"></script>
<div id="chartdiv"></div>
<style>
#chartdiv {
  width: 100%;
  height: 400px;
}
</style>// Themes begin
am4core.useTheme(am4themes_animated);
// Themes end
// Create chart instance
var chart = am4core.create("chartdiv", am4charts.XYChart);
// Add data
chart.data = [
{
type: "gauge",
bad: 2,
good: 7,
worst: 1
}
];
// Create axes
var categoryAxis = chart.yAxes.push(new am4charts.CategoryAxis());
categoryAxis.dataFields.category = "type";
categoryAxis.renderer.grid.template.location = 0;
categoryAxis.renderer.minGridDistance = 20;
// forcefully expand axis to make it look like gauge
categoryAxis.renderer.cellStartLocation = -0.12;
categoryAxis.renderer.cellEndLocation = 1.12;
categoryAxis.visible = false;
var valueAxis = chart.xAxes.push(new am4charts.ValueAxis());
// remove inner margins by syncing its start and end with min and max
valueAxis.min = 0;
valueAxis.max = 10;
// Create series
function createSeries(field, name, stacked) {
var series = chart.series.push(new am4charts.ColumnSeries());
series.dataFields.valueX = field;
series.dataFields.categoryY = "type";
series.name = name;
series.columns.template.tooltipText = "{name}: [bold]{valueX[/]}";
series.stacked = stacked;
// add inner text
const bullet = series.bullets.push(new am4charts.LabelBullet());
bullet.label.text = "{name}";
bullet.locationX = 0.5;
}
createSeries("good", "Good", false); // base of stacked column
createSeries("bad", "Bad", true);
createSeries("worst", "Worst", true);
// Add legend
chart.legend = new am4charts.Legend();编辑
我已经按要求加了手。
- 添加了另一列,并将其指定为非集群,以使其忽略网格布局。
- 将列的交互和样式设置为隐藏,并附加了一个看起来像“时钟手”的子弹形。
- 包含大量手动位置操作;由于预先制作的图表的限制。
。
顺便提一句,通常情况下,如果图表中有什么不寻常的元素,最好用D3.js来实现它;修改预先制作的图表以后会带来太多的副作用。
// adding a pointing hand(clock hand) as annotation
// draw pointing hand
var series = chart.series.push(new am4charts.ColumnSeries());
series.dataFields.valueX = "current";
series.dataFields.categoryY = "type";
series.fillOpacity = 0;
// hide shape
series.stroke = am4core.color("rgba(0,0,0,0)");
// make it ignore other columns
series.clustered = false;
// disable tooltips
series.interactionsEnabled = false;
const bullet = series.bullets.push(new am4core.Triangle());
bullet.width = 30;
bullet.height = 30;
bullet.fill = am4core.color("black");
bullet.horizontalCenter = "middle";
bullet.verticalCenter = "top";
bullet.rotation = 180;
// manually change its position
bullet.dy = -65;

const label = series.bullets.push(new am4charts.LabelBullet());
label.label.text = "current: {valueX}";
label.label.dy = -30;带指针的更新工作演示(时钟手):https://codepen.io/rabelais88/pen/mdxOyYQ
页面原文内容由Stack Overflow提供。腾讯云小微IT领域专用引擎提供翻译支持
原文链接:
https://stackoverflow.com/questions/72889402
复制相关文章
相似问题
腾讯云开发者
