
用.mat文件绘制心电图
用.mat文件绘制心电图
提问于 2022-07-10 12:59:34
我刚接触到python,我们如何从python中的.mat文件中绘制出一个心电图信号?
代码:
import matplotlib.pyplot as plt
import ecg_plot
import scipy.io as sio
import numpy as np
from scipy.misc import electrocardiogram
ecg=sio.loadmat('/content/hc001.mat')
print(ecg)
答案:
{'val': array([[ 21, 22, 24, ..., 236, 174, 84]], dtype=int16)}回答 2
Stack Overflow用户
发布于 2022-07-10 13:47:18
这是使用ecg_plot包的一个相当简单的方法:
安装在终端:pip install ecg_plot
然后在Python中:
import ecg_plot

ecg=sio.loadmat('/content/hc001.mat')
ecg_plot.plot(ecg, sample_rate = 500)
ecg_plot.show()Stack Overflow用户
发布于 2022-07-11 21:50:23
对于下面的示例,我已经从这里下载了ECG mat文件。
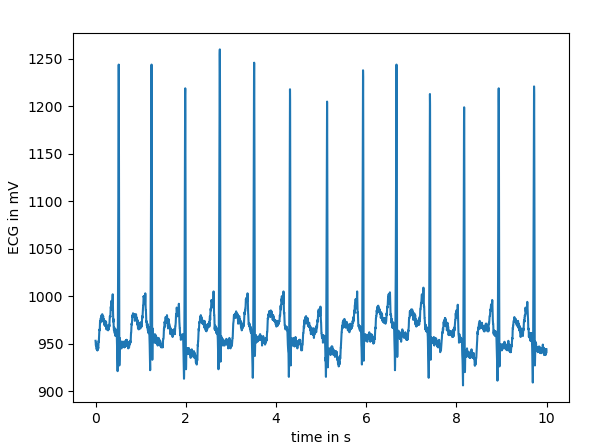
您可以使用常用的matplotlib库按以下方式绘制心电数据:
import matplotlib.pyplot as plt
import numpy as np
import scipy.io as sio

ecg = sio.loadmat('100m (0).mat')['val'].reshape((-1))

fs = 360
time = np.arange(ecg.size) / fs
plt.plot(time, ecg)
plt.xlabel("time in s")
plt.ylabel("ECG in mV")
plt.show()
有关更多细节,请看一下来自scipy的这个scipy。
页面原文内容由Stack Overflow提供。腾讯云小微IT领域专用引擎提供翻译支持
原文链接:
https://stackoverflow.com/questions/72928651
复制相关文章
相似问题
腾讯云开发者
