
为什么我的残差的正常Q-Q图是一条垂直线?
为什么我的残差的正常Q-Q图是一条垂直线?
提问于 2022-07-14 16:52:33
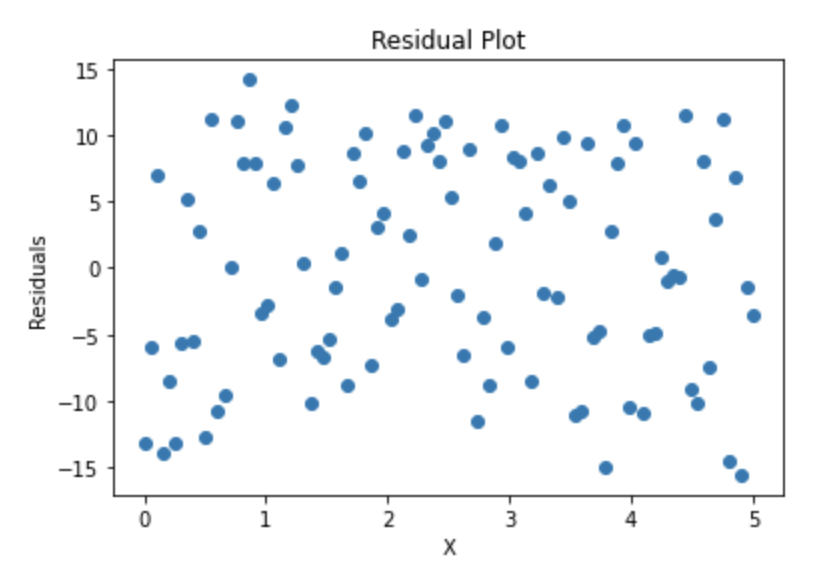
我用Q-Q图来检验我的线性回归的残差是否服从正态分布,但结果是一条垂直线。
看起来线性回归是这个数据集的一个很好的模型,所以不应该将残差分布为
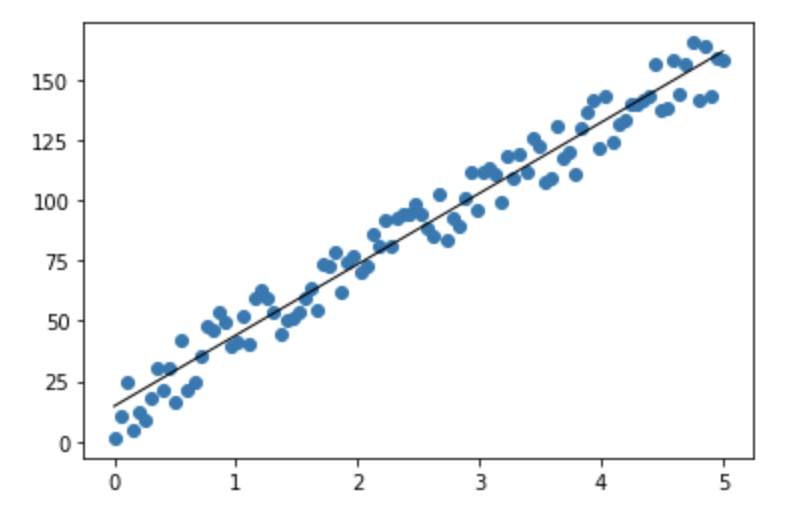
这些点是随机创建的:
import numpy as np

x_values = np.linspace(0, 5, 100)[:, np.newaxis]
y_values = 29 * x_values + 30 * np.random.rand(100, 1)
然后,我拟合了线性回归模型:
from sklearn.linear_model import LinearRegression
reg = LinearRegression()
reg.fit(x_values, y_values)
predictions = reg.predict(x_values)
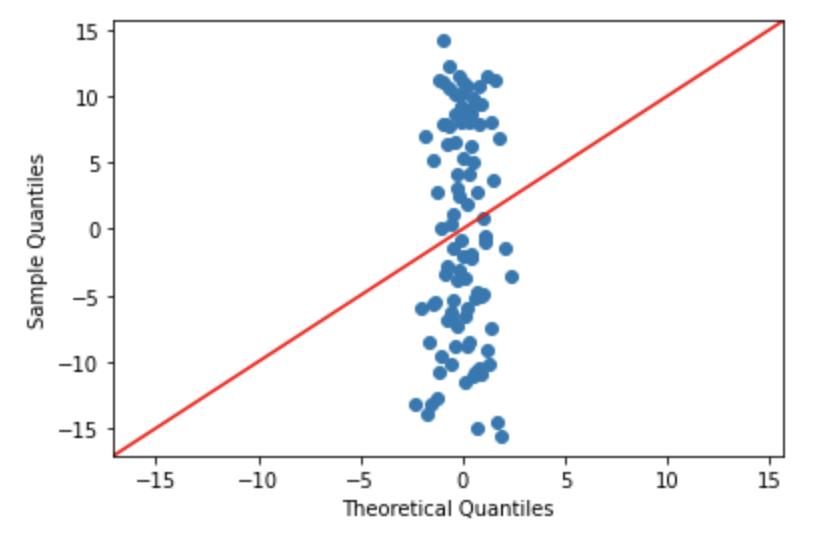
residuals = y_values - predictions最后,我使用statsmodel模块来绘制残差的Q图:
fig = sm.qqplot(residuals, line='45')Stack Overflow用户
回答已采纳
发布于 2022-07-14 18:29:53
你的问题是双重的
- 主要的问题是,
sklearn希望输入是一个2d的列数组,而来自statsmodels的qqplot则希望您的数据位于真正的一维数组中。当您将残差传递给qqplot时,它试图单独转换每个残差,而不是转换整个dataset
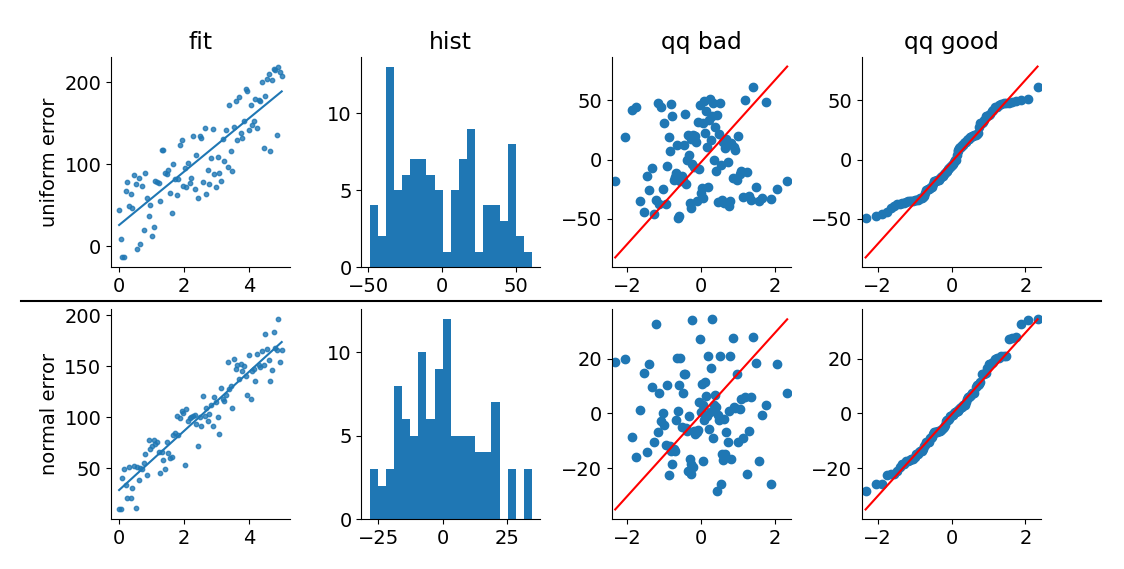
numpy.random.rand是一个统一的分布,所以您的错误是不正常的!
为了突出这一点,我已经修改了您的代码示例。结果图中的顶部行包括预测&对均匀剩余分布的残差,而底部行使用正态分布表示错误。
"qq_bad"和"qq_good"图之间的区别仅仅在于选择数据列并将其作为真正的一维数组传入(而不是一维列数组)。
from matplotlib.pyplot import subplot_mosaic, show, rc
from matplotlib.lines import Line2D
from matplotlib.transforms import blended_transform_factory
from numpy.random import default_rng
from numpy import linspace
from sklearn.linear_model import LinearRegression
from statsmodels.api import qqplot
from scipy.stats import zscore

rc('font', size=14)
rc('axes.spines', top=False, right=False)

rng = default_rng(0)
size = 100

x_values = linspace(0, 5, size)[:, None]
errors = {
    'uniform': rng.uniform(low=-50, high=50, size=(size, 1)),
    'normal':  rng.normal(loc=0, scale=15, size=(size, 1))
}

fig, axd = subplot_mosaic([
    ['uniform_fit', 'uniform_hist', 'uniform_qq_bad', 'uniform_qq_good'],
    ['normal_fit', 'normal_hist', 'normal_qq_bad', 'normal_qq_good']
], figsize=(12, 6), gridspec_kw={'wspace': .4, 'hspace': .2})

for err_type, err in errors.items():
    reg = LinearRegression()
    y_values = 29 * x_values + 30 + err

    fit = reg.fit(x_values, y_values)
    predictions = fit.predict(x_values)
    residuals = predictions - y_values

    axd[f'{err_type}_fit'].scatter(x_values, y_values, s=10, alpha=.8)
    axd[f'{err_type}_fit'].plot(x_values, predictions)

    axd[f'{err_type}_hist'].hist(residuals, bins=20)

    qqplot(residuals, ax=axd[f'{err_type}_qq_bad'], line='q')
    qqplot(residuals[:, 0], ax=axd[f'{err_type}_qq_good'], line='q')

####
# Below is primarily for plot aesthetics, feel free to ignore

for label, ax in axd.items():
    ax.set_ylabel(None)
    ax.set_xlabel(None)

    if label.startswith('uniform'):
        ax.set_title(label.replace('uniform_', '').replace('_', ' '))

    if label.endswith('fit'):
        ax.set_ylabel(f'{label.replace("_fit", "")} error')

line = Line2D(
    [.05, .95], [1.04, 1.04],
    color='black',
    transform=blended_transform_factory(fig.transFigure, ax.transAxes),
)
fig.add_artist(line)

show()
页面原文内容由Stack Overflow提供。腾讯云小微IT领域专用引擎提供翻译支持
原文链接:
https://stackoverflow.com/questions/72984094
复制相关文章
相似问题
腾讯云开发者

Copyright © 2013 - 2026 Tencent Cloud. All Rights Reserved. 腾讯云 版权所有
深圳市腾讯计算机系统有限公司 ICP备案/许可证号:粤B2-20090059 ![]() 粤公网安备44030502008569号
粤公网安备44030502008569号
腾讯云计算(北京)有限责任公司 京ICP证150476号 | 京ICP备11018762号