
如何在OpenModelica 1.19.0中使用DynamicSelect动画
如何在OpenModelica 1.19.0中使用DynamicSelect动画
提问于 2022-07-17 13:48:31
根据OpenModelica,DynamicSelect的文档,
任何值(坐标、颜色、文本等)在图形注释中,可以使用DynamicSelect表达式依赖于类变量。DynamicSelect具有带有两个参数的函数调用的语法,其中第一个参数指定编辑状态的值,第二个参数指定非编辑状态的值。第一个参数必须是一个文字表达式,该值用于编辑和/或浏览图表层时的注释。第二个参数可以包含对变量的引用,以启用动态行为,并且实际值用于图层的示意图动画的注释,例如在模拟之后。
为了进行测试,使用DynamicSelect创建了一个模型,用于在模拟期间更改颜色和坐标。
  model BarGraph_v001
  Modelica.Blocks.Interfaces.RealInput u annotation(
      Placement(visible = true, transformation(origin = {-104, 0}, extent = {{-20, -20}, {20, 20}}, rotation = 0), iconTransformation(origin = {-62, 0}, extent = {{-20, -20}, {20, 20}}, rotation = 0)));
  equation


  annotation(
      Icon(graphics = {
      Rectangle(lineThickness = 2, extent = DynamicSelect({{-40, 100}, {40, -100}},{{-40, 100}, {u, -100}})),
      Rectangle(visible=true, origin = DynamicSelect({0, 27},{0,u}), fillColor=DynamicSelect({192,192,192}, {125+u*5,125-u*5,125+u*5}), fillPattern = FillPattern.Solid, extent = {{-40, 13}, {40, -13}})}));

  end BarGraph_v001;
注意,DynamicSelect用于更改图标中矩形的原点和颜色的坐标。
此模型的静态图标是:
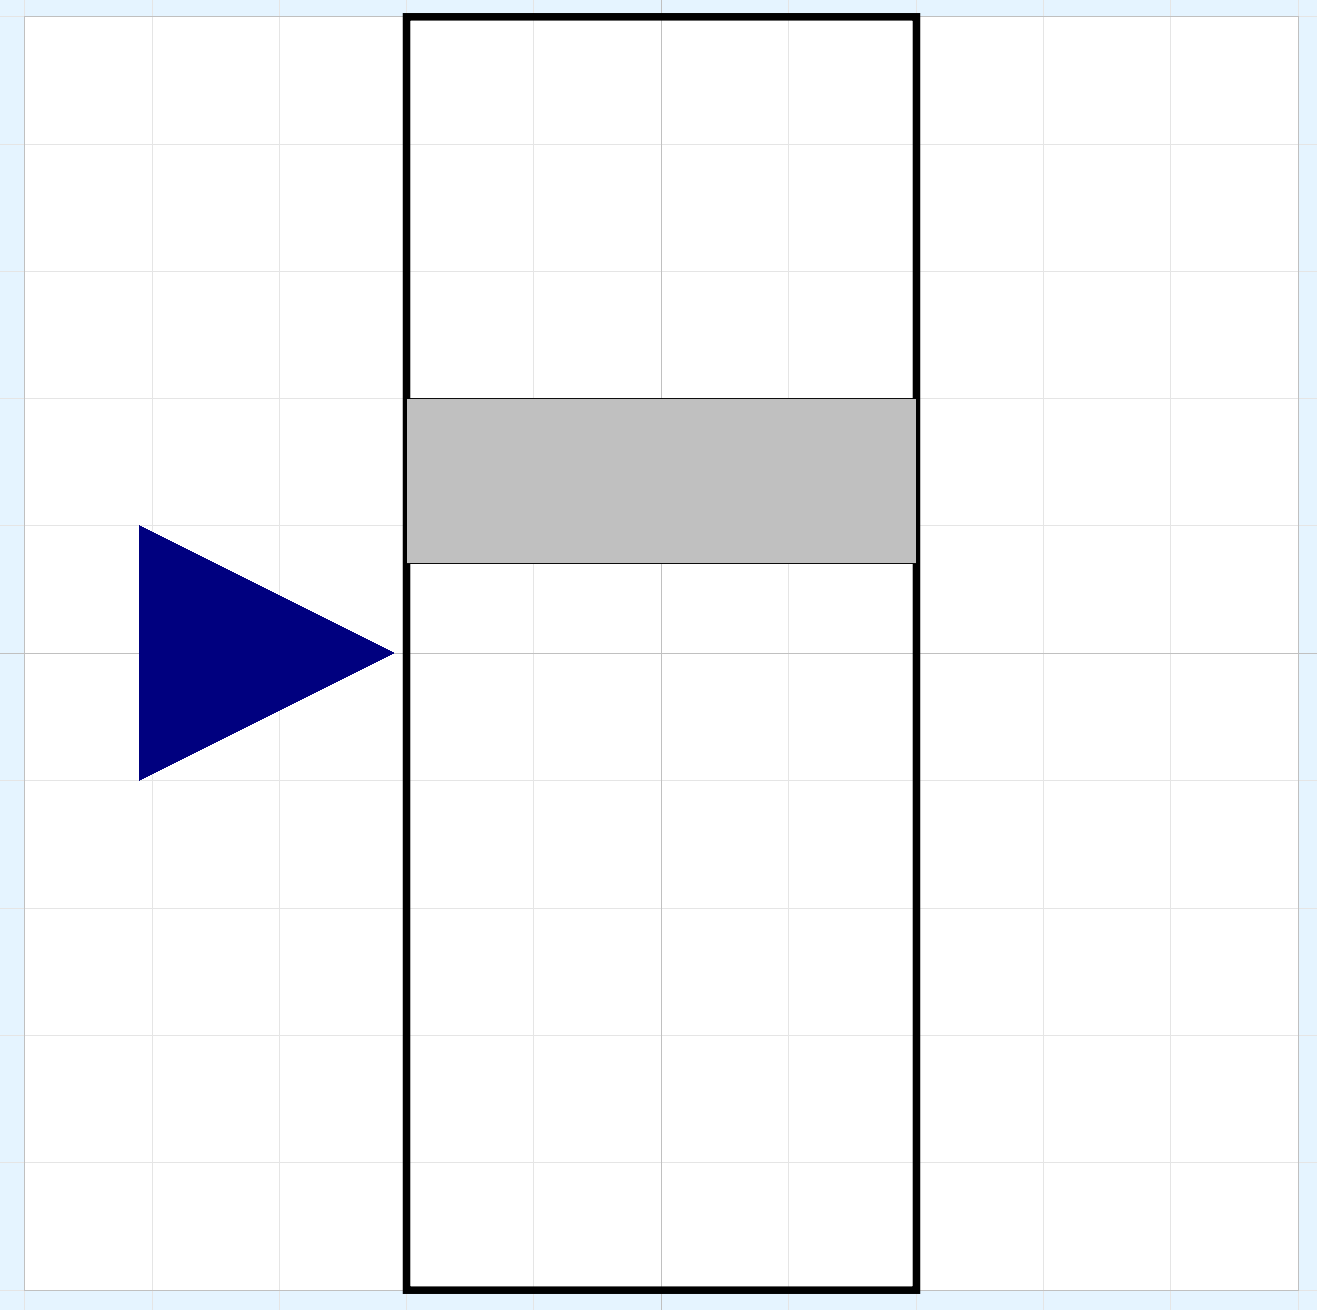
然后将其集成到一个带有刺激的模型和其他几个动画Modelica库元素中。
model BarGraph_test_001
Anim.BarGraph_v001 barGraph_v001 annotation(
    Placement(visible = true, transformation(origin = {22, 0}, extent = {{-10, -10}, {10, 10}}, rotation = 0)));
Modelica.Blocks.Sources.Sine sine(f = 4)  annotation(
    Placement(visible = true, transformation(origin = {-54, 0}, extent = {{-10, -10}, {10, 10}}, rotation = 0)));
Modelica.Blocks.Math.Gain gain(k = 25)  annotation(
    Placement(visible = true, transformation(origin = {-14, 0}, extent = {{-10, -10}, {10, 10}}, rotation = 0)));
Modelica.Blocks.Interaction.Show.RealValue realValue annotation(
    Placement(visible = true, transformation(origin = {28, 24}, extent = {{-10, -10}, {10, 10}}, rotation = 0)));
Modelica.Blocks.Interaction.Show.BooleanValue booleanValue annotation(
    Placement(visible = true, transformation(origin = {56, -36}, extent = {{-10, -10}, {10, 10}}, rotation = 0)));
Modelica.Blocks.Logical.GreaterThreshold greaterThreshold annotation(
    Placement(visible = true, transformation(origin = {18, -36}, extent = {{-10, -10}, {10, 10}}, rotation = 0)));
equation
  connect(gain.y, barGraph_v001.u) annotation(
    Line(points = {{-2, 0}, {16, 0}}, color = {0, 0, 127}));
connect(sine.y, gain.u) annotation(
    Line(points = {{-42, 0}, {-26, 0}}, color = {0, 0, 127}));
connect(realValue.numberPort, gain.y) annotation(
    Line(points = {{16, 24}, {8, 24}, {8, 0}, {-2, 0}}, color = {0, 0, 127}));
connect(greaterThreshold.y, booleanValue.activePort) annotation(
    Line(points = {{30, -36}, {44, -36}}, color = {255, 0, 255}));
connect(greaterThreshold.u, gain.y) annotation(
    Line(points = {{6, -36}, {-2, -36}, {-2, -12}, {10, -12}, {10, 0}, {-2, 0}}, color = {0, 0, 127}));
end BarGraph_test_001;
该模型在编辑器中如下所示:
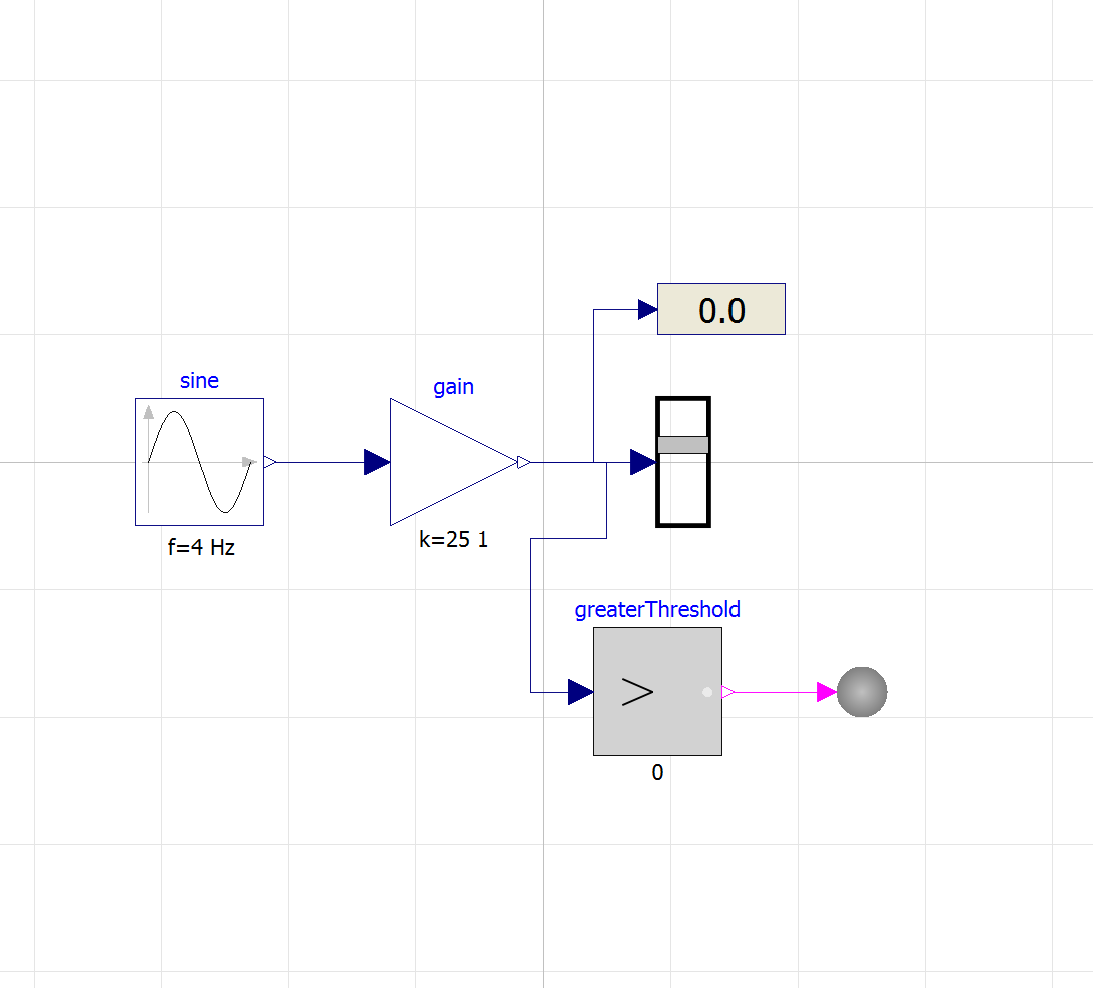
经过模拟,它像这样被动画化了。注意到颜色变化,库部件是动画的,但是用于更改坐标的DynamicSelect不起作用。
问题:
- 在本例中是否正确使用了DynamicSelect?
- 在DynamicSelect连接编辑器2.19.0中支持OpenModelica坐标更改吗?
回答 1
Stack Overflow用户
回答已采纳
发布于 2022-07-20 08:57:48
在Dymola中更改矩形的大小:
但是,当前版本的OMEdit (v1.19.2)似乎并不完全支持DynamicSelect。
github上有一个关于DynamicSelect支持的OpenModelica:#3675:添加交互式模拟支持(例如,DynamicSelect显示)问题
页面原文内容由Stack Overflow提供。腾讯云小微IT领域专用引擎提供翻译支持
原文链接:
https://stackoverflow.com/questions/73012325
复制相关文章
相似问题
腾讯云开发者
