
如何降低ggpubr中某一组颜色的透明度?
如何降低ggpubr中某一组颜色的透明度?
提问于 2022-07-27 08:49:43
我如何改变一个小组在ggpubr图解中的透明度。示例数据集
library(ggpubr)
# Load data
data("mtcars")
df <- mtcars
df$cyl <- as.factor(df$cyl)
head(df[, c("wt", "mpg", "cyl")], 3)
数据如下:
               wt    mpg    cyl
              <dbl> <dbl>   <fct>
Mazda RX4     2.620  21.0   6
Mazda RX4 Wag 2.875  21.0   6
Datsun 710    2.320  22.8   4
我尝试使用以下代码创建带有回归线的绘图:
ggscatter(df, x = "wt", y = "mpg",
          add = "reg.line", add.params = list(color = "white", fill = "blue"),
          conf.int = TRUE, # Add confidence interval
          cor.coef = TRUE, # Add correlation coefficient
          cor.coeff.args = list(method = "pearson"),
          color = "cyl", shape = "cyl",
          palette = c("#FF0000", "#0000FF", "#00FF00"),
          ellipse = TRUE
         )
# ggsave('test.png', width=6, height=6, units="in", dpi=300)
它给了我如下的产出:
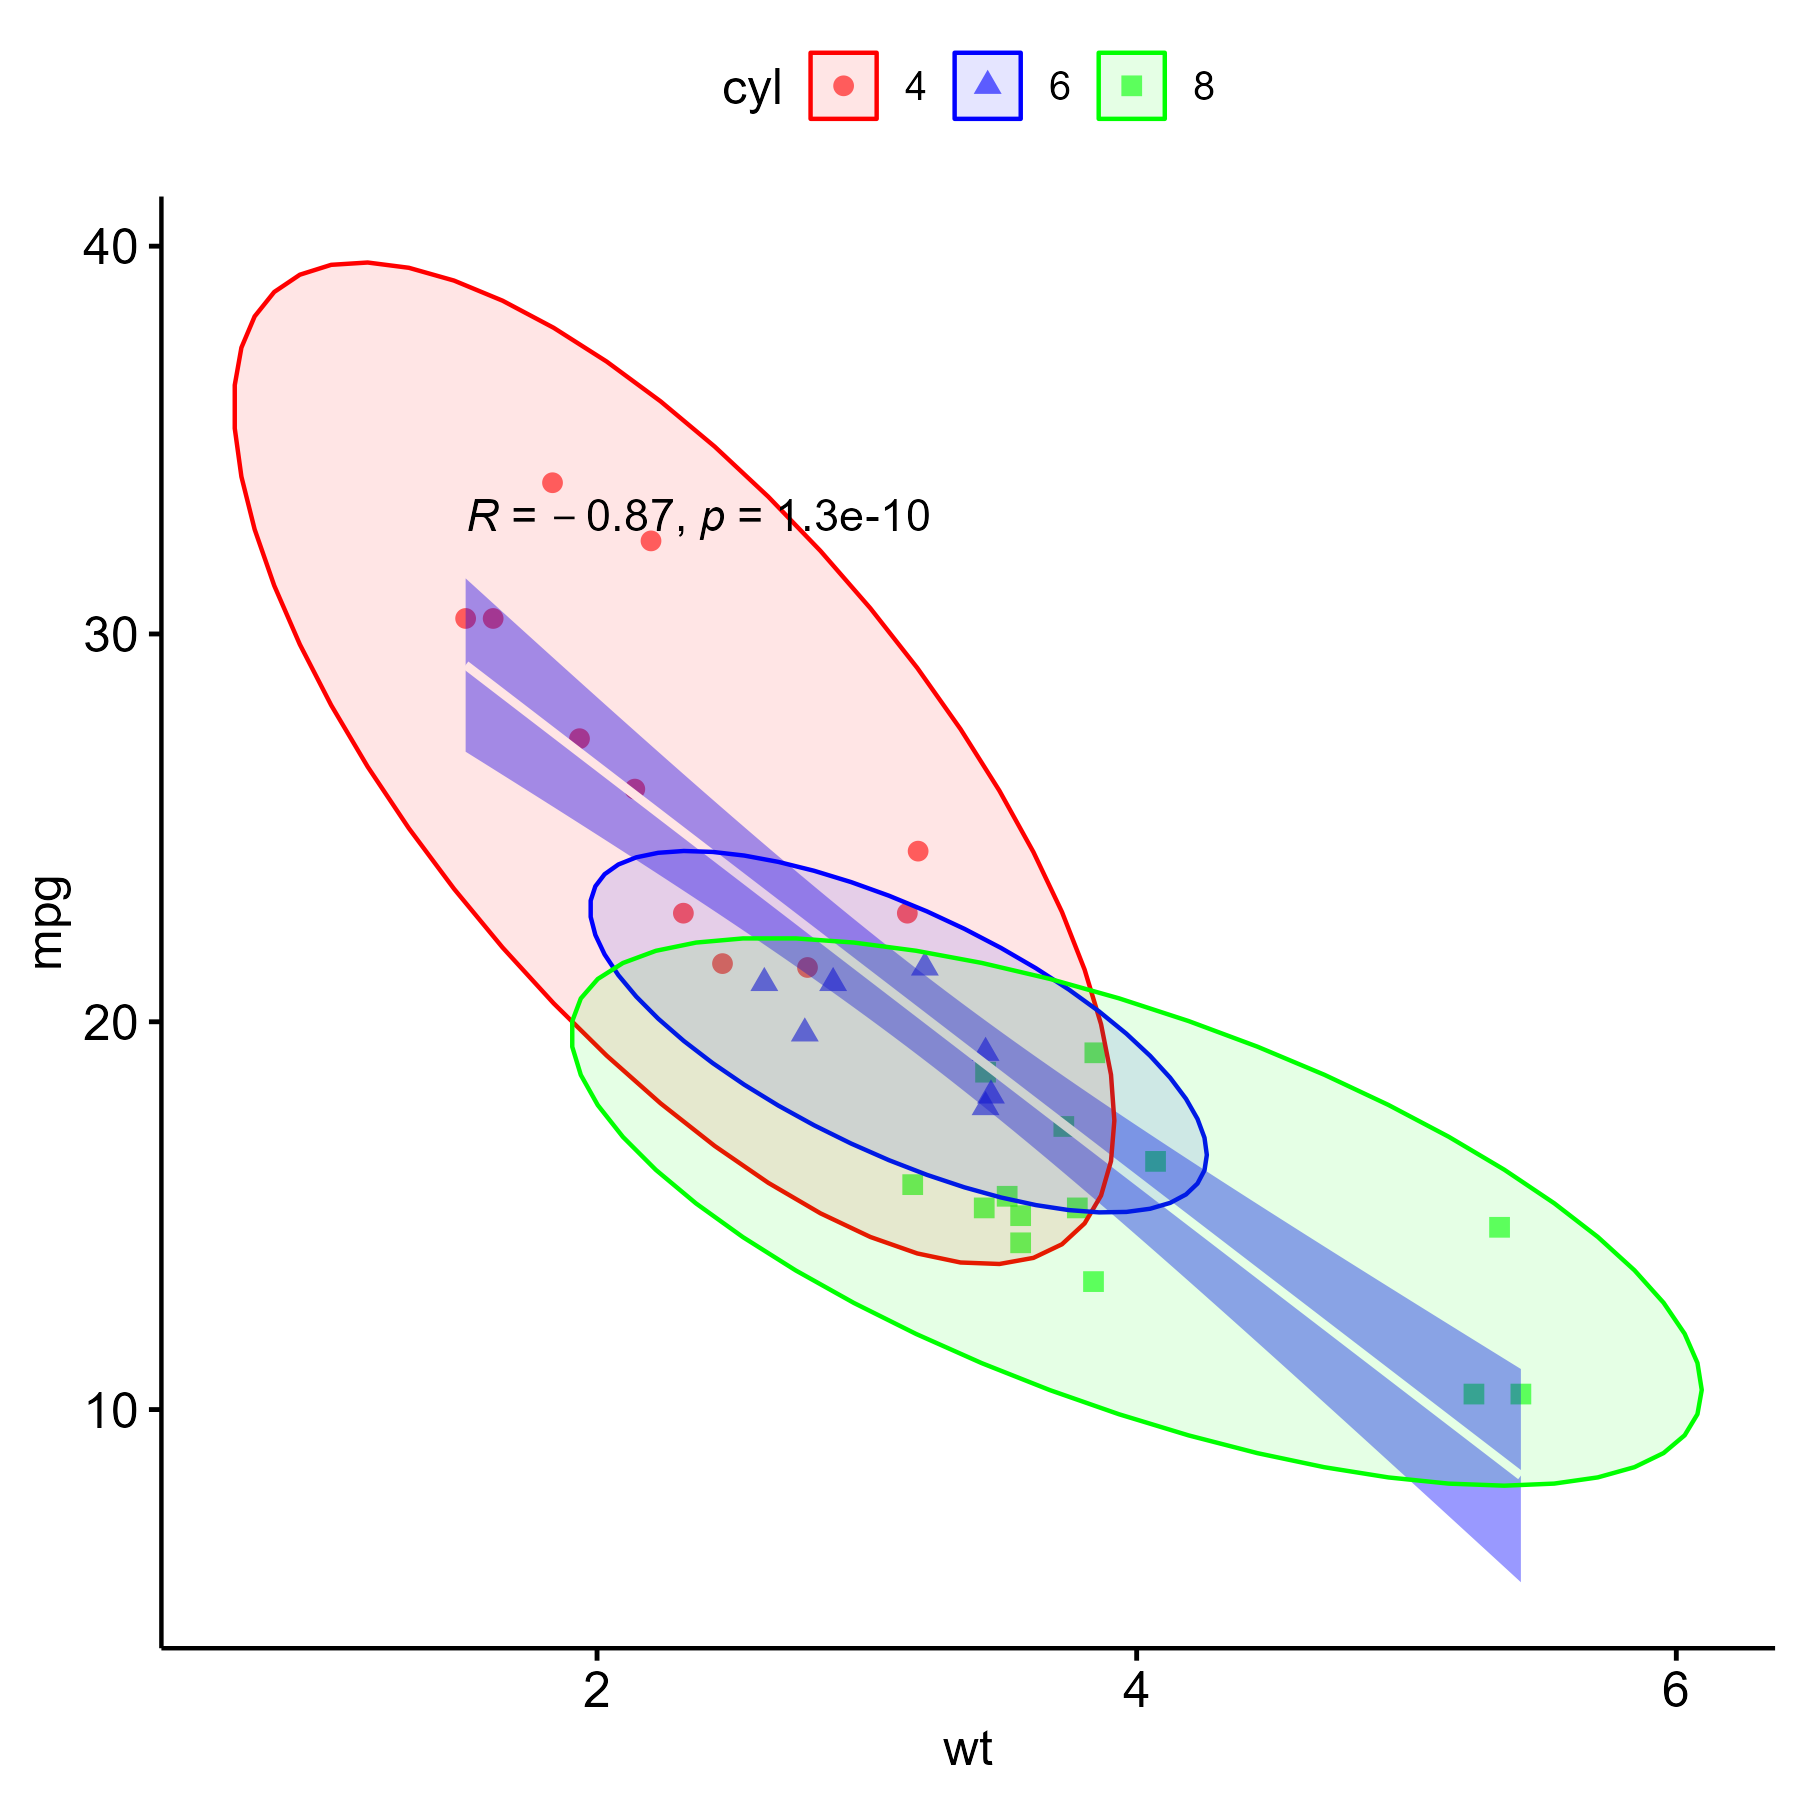
我想使红色更透明,从这个数字。
回答 2
Stack Overflow用户
回答已采纳
发布于 2022-07-27 09:27:11
您可以通过更改ggplot对象本身来更改alpha,而不是在生成图之后更改grobs。这使图例与情节一致,并允许您修改主题元素、比例等。
library(ggpubr)

data("mtcars")
df <- mtcars
df$cyl <- as.factor(df$cyl)

p <- ggscatter(df, x = "wt", y = "mpg",
          add = "reg.line", add.params = list(color = "white", fill = "blue"),
          conf.int = TRUE, # Add confidence interval
          cor.coef = TRUE, # Add correlation coefficient
          cor.coeff.args = list(method = "pearson"),
          color = "cyl", shape = "cyl",
          palette = c("#FF0000", "#0000FF", "#00FF00"),
          ellipse = TRUE
         )

p$layers[[3]]$aes_params <- list()
p$layers[[3]]$mapping <- aes(wt, mpg, color = cyl, fill = cyl, group = cyl,
                             alpha = cyl)
p <- p + scale_alpha_manual(values = c(0.02, 0.2, 0.2), name = "cyl")

p

Stack Overflow用户
发布于 2022-07-27 09:21:26
这是一个有趣的故事。有一个ellipse.alpha参数,应该允许为其赋值向量。但是,如果使用df$ellipse_alpha <- ifelse(df$cyl==4, 0.01, 0.2)创建alpha值列并尝试将其分配给ellipse.alpha,则会引发一个错误:
`geom_smooth()` using formula 'y ~ x'
Error in `check_aesthetics()`:
! Aesthetics must be either length 1 or the same as the data (156): alpha我不太清楚156是从哪里来的,因为数据是32行。但是,我们可以通过使用ggplot_build()编辑底层的绘图数据来解决这一问题。
# Assign plot (same code as yours) to p
p  <- ggscatter(df, x = "wt", y = "mpg",
          add = "reg.line", add.params = list(color = "white", fill = "blue"),
          conf.int = TRUE, # Add confidence interval
          cor.coef = TRUE, # Add correlation coefficient
          cor.coeff.args = list(method = "pearson"),
          color = "cyl", shape = "cyl",
          palette = c("#FF0000", "#0000FF", "#00FF00"),
          ellipse = TRUE
         )

# Look at each layer and find the one which is
# stat_ellipse - in this case [[3]]
print(p$layers)
# [[3]]
# mapping: x = ~wt, y = ~mpg, colour = ~cyl, group = ~cyl, fill = ~cyl
# geom_polygon: na.rm = FALSE
# stat_ellipse: type = norm, level = 0.95, segments = 51, na.rm = FALSE
# position_identity
一旦我们知道需要编辑的是哪一层,我们就可以更改底层数据的alpha:
# Get data
plot_data  <- ggplot_build(p)

# Edit the alpha in the desired group (1 in this case)
plot_data[["data"]][[3]]$alpha  <- ifelse(
    plot_data[["data"]][[3]]$group == 1,
    0.02,
    0.2
)

# Convert to grob
grob  <- ggplot_gtable(plot_data)

# Draw grob as plot
as_ggplot(grob)
页面原文内容由Stack Overflow提供。腾讯云小微IT领域专用引擎提供翻译支持
原文链接:
https://stackoverflow.com/questions/73134888
复制相关文章
相似问题
腾讯云开发者
