
如何计算R中一个数据帧的多行MSE?
如何计算R中一个数据帧的多行MSE?
提问于 2022-08-01 20:09:00
我有一个数据框架(datos),其中有八列和2006年的观察结果:
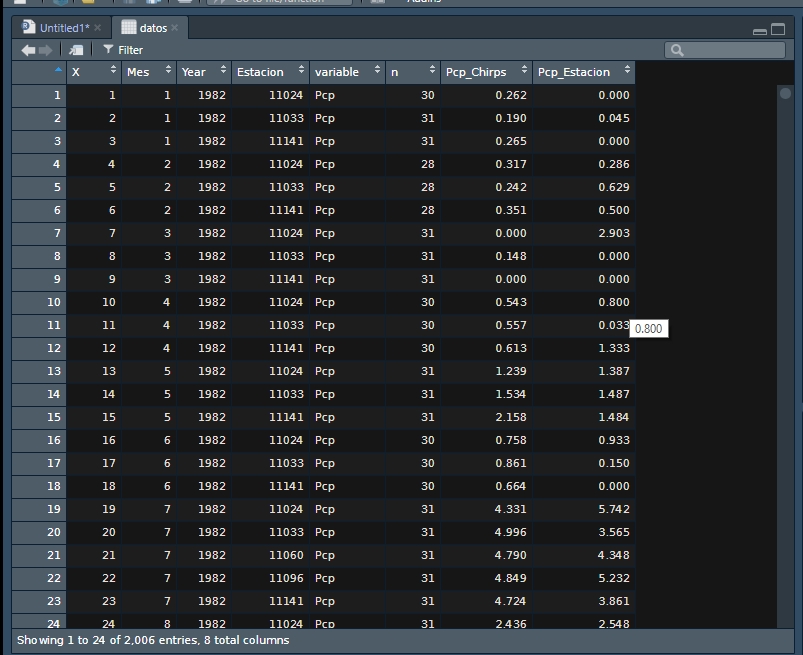
从这些列中,我希望使用Pcp_Estacion库的MSE函数计算MLmetrics和Pcp_Chirps的MSE,但我希望计算每个站点和每个月的MSE,以获得每个月和每个气象站的数据框架,在示例中,我计算了我7月份拥有的5个气象站的MSE。
# load libraries
library(tidyverse);
library(dplyr);
library(Metrics);
library(MLmetrics);

# See the first 10 data
dput(head(datos, 10))

    X Mes Year Estacion variable  n Pcp_Chirps Pcp_Estacion
1   1   1 1982    11024      Pcp 30      0.262        0.000
2   2   1 1982    11033      Pcp 31      0.190        0.045
3   3   1 1982    11141      Pcp 31      0.265        0.000
4   4   2 1982    11024      Pcp 28      0.317        0.286
5   5   2 1982    11033      Pcp 28      0.242        0.629
6   6   2 1982    11141      Pcp 28      0.351        0.500
7   7   3 1982    11024      Pcp 31      0.000        2.903
8   8   3 1982    11033      Pcp 31      0.148        0.000
9   9   3 1982    11141      Pcp 31      0.000        0.000
10 10   4 1982    11024      Pcp 30      0.543        0.800

# Calculate the July mse() for each weather station
mse_11024_7 <- filter(datos, Mes == 7, Estacion %in% c("11024"))
mse_11033_7 <- filter(datos, Mes == 7, Estacion %in% c("11033"))
mse_11060_7 <- filter(datos, Mes == 7, Estacion %in% c("11060"))
mse_11096_7 <- filter(datos, Mes == 7, Estacion %in% c("11096"))
mse_11141_7 <- filter(datos, Mes == 7, Estacion %in% c("11141"))

# check the result
mse(mse_11024_7$Pcp_Estacion, mse_11024_7$Pcp_Chirps)
mse(mse_11033_7$Pcp_Estacion, mse_11033_7$Pcp_Chirps)
mse(mse_11060_7$Pcp_Estacion, mse_11060_7$Pcp_Chirps)
mse(mse_11096_7$Pcp_Estacion, mse_11096_7$Pcp_Chirps)
mse(mse_11141_7$Pcp_Estacion, mse_11141_7$Pcp_Chirps)
是否有更快的方法一次做到这一切,所有的月份和气象站?
这里的示例数据https://drive.google.com/drive/folders/19h7u0GzGO1okjhO3RLREY0QKY8DOoTy-?usp=sharing
回答 1
Stack Overflow用户
发布于 2022-08-01 21:36:08
如果你提供一个最少的可重复的例子,你将有更好的机会得到一个有用的答案。但是,以下内容应能满足您的需要:
library(dplyr)

datos %>%
  filter(Mes == 7) %>%
  group_by(Estacion) %>%
summarise(Mse = mse(Pcp_Chirps))其方法是在使用Estacion计算每个组的最小均方值之前,根据summarise()的值对数据进行分区(即“组”)。
页面原文内容由Stack Overflow提供。腾讯云小微IT领域专用引擎提供翻译支持
原文链接:
https://stackoverflow.com/questions/73199071
复制相关文章
相似问题
腾讯云开发者
