
用excel文件在Python中绘制热图
用excel文件在Python中绘制热图
提问于 2022-08-12 05:54:38
我需要使用excel文件中的x, y, z数据在python中绘制一个热图。z的所有值除(x=5,y=5)值外均为1。地块在(5,5)点应该是红色的,在其他地方应该是蓝色的。但是我收到了错误的警报,需要移除。我用的是“喷气式”
X=[0,0,0,0,0,0,0,0,0,0,1,1,1,1,1,1,1,1,1,1,2,2,2,2,2,2,2,2,2,2,3,3,3,3,3,3,3,3,3,3,4,4,4,4,4,4,4,4,4,4,5,5,5,5,5,5,5,5,5,5,6,6,6,6,6,6,6,6,6,6,7,7,7,7,7,7,7,7,7,7,8,8,8,8,8,8,8,8,8,8,9,9,9,9,9,9,9,9,9,9]
Y=[0,1,2,3,4,5,6,7,8,9,0,1,2,3,4,5,6,7,8,9,0,1,2,3,4,5,6,7,8,9,0,1,2,3,4,5,6,7,8,9,0,1,2,3,4,5,6,7,8,9,0,1,2,3,4,5,6,7,8,9,0,1,2,3,4,5,6,7,8,9,0,1,2,3,4,5,6,7,8,9,0,1,2,3,4,5,6,7,8,9,0,1,2,3,4,5,6,7,8,9]
Z=[1,1,1,1,1,1,1,1,1,1,1,1,1,1,1,1,1,1,1,1,1,1,1,1,1,1,1,1,1,1,1,1,1,1,1,1,1,1,1,1,1,1,1,1,1,1,1,1,1,1,1,1,1,1,1,9,1,1,1,1,1,1,1,1,1,1,1,1,1,1,1,1,1,1,1,1,1,1,1,1,1,1,1,1,1,1,1,1,1,1,1,1,1,1,1,1,1,1,1,1]
我使用的代码是:
import matplotlib.pyplot as plt
import numpy as np
from numpy import ravel
from scipy.interpolate import interp2d
import pandas as pd
import matplotlib as mpl

excel_data_df = pd.read_excel('test.xlsx')
X= excel_data_df['x'].tolist()
Y= excel_data_df['y'].tolist()
Z= excel_data_df['z'].tolist()

x_list = np.array(X)
y_list = np.array(Y)
z_list = np.array(Z)

#   f will be a function with two arguments (x and y coordinates),
# but those can be array_like structures too, in which case the
# result will be a matrix representing the values in the grid
# specified by those arguments
f = interp2d(x_list,y_list,z_list,kind="linear")
x_coords = np.arange(min(x_list),max(x_list))
y_coords = np.arange(min(y_list),max(y_list))
z= f(x_coords,y_coords)

fig = plt.imshow(z,
           extent=[min(x_list),max(x_list),min(y_list),max(y_list)],
           origin="lower", interpolation='bicubic', cmap= 'jet', aspect='auto')

# Show the positions of the sample points, just to have some reference
fig.axes.set_autoscale_on(False)
#plt.scatter(x_list,y_list,400, facecolors='none')
plt.xlabel('X Values', fontsize = 15, va="center")
plt.ylabel('Y Values', fontsize = 15,va="center")
plt.title('Heatmap', fontsize = 20)
plt.tight_layout()
plt.show()
为了您的方便,您也可以使用X,Y,Z数组,而不是读取excel文件。
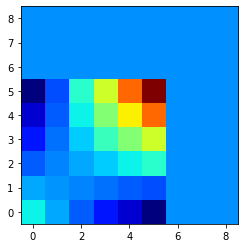
我得到的结果是:
在这里,你可以看到深蓝色区域在(5,0)和(0,5)。这些是我收到的假警报,我需要删除这些。我可能是在犯初学者的错误。感谢任何指出这一点的人。问候
回答 1
Stack Overflow用户
回答已采纳
发布于 2022-08-12 09:58:31
在您的示例中至少有三个问题:
x_coords和y_coords没有正确地重放;插值z做的- 填充整个网格导致不正确的输出;
- ,输出被迫在原始网格(
extent)上绘制,这增加了混乱。
由此得出以下插值结果:
你用imshow做了一个额外的平滑处理。
让我们创建您的人工输入:
import matplotlib.pyplot as plt
import numpy as np
x = np.arange(0, 11)
y = np.arange(0, 11)
X, Y = np.meshgrid(x, y)
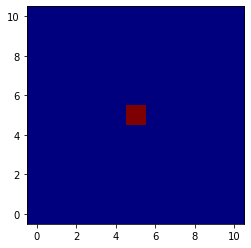
Z = np.ones(X.shape)
Z[5,5] = 9
根据您想要进行的方式,您可以简单地通过插值让imshow平滑您的信号:
fig, axe = plt.subplots()
axe.imshow(Z, origin="lower", cmap="jet", interpolation='bicubic')
你完成了,简单而高效!
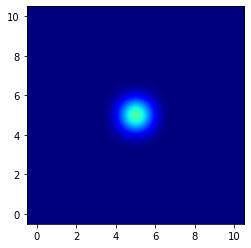
如果你想自己做这件事,那么在分辨率更高的网格上选择最适合你的插值和重采样:
interpolant = interpolate.interp2d(x, y, Z.ravel(), kind="linear")

xlin = np.linspace(0, 10, 101)
ylin = np.linspace(0, 10, 101)
zhat = interpolant(xlin, ylin)

fig, axe = plt.subplots()
axe.imshow(zhat, origin="lower", cmap="jet")

深入了解scipy.interpolate模块,以获取关于您的需求的最佳插值。请注意,所有方法都不公开用于输入参数的相同接口。您可能需要重新调整数据以使用其他对象。
MCVE
下面是一个使用上面生成的试用数据的完整示例。只需将其绑定到excel列:
# Flatten trial data to meet your requirement:
x = X.ravel()
y = Y.ravel()
z = Z.ravel()

# Resampling on as square grid with given resolution:
resolution = 11
xlin = np.linspace(x.min(), x.max(), resolution)
ylin = np.linspace(y.min(), y.max(), resolution)
Xlin, Ylin = np.meshgrid(xlin, ylin)

# Linear multi-dimensional interpolation:
interpolant = interpolate.NearestNDInterpolator([r for r in zip(x, y)], z)
Zhat = interpolant(Xlin.ravel(), Ylin.ravel()).reshape(Xlin.shape)

# Render and interpolate again if necessary:
fig, axe = plt.subplots()
axe.imshow(Zhat, origin="lower", cmap="jet", interpolation='bicubic')
如预期那样呈现:

页面原文内容由Stack Overflow提供。腾讯云小微IT领域专用引擎提供翻译支持
原文链接:
https://stackoverflow.com/questions/73329761
复制相关文章
相似问题
腾讯云开发者
