
将ggsurvplot图例文本颜色与行颜色匹配,包括风险表。
与this previous post about changing the color of the figure legend text to match graphing colors in ggplot相关,我想将其扩展到ggsurvplot对象。
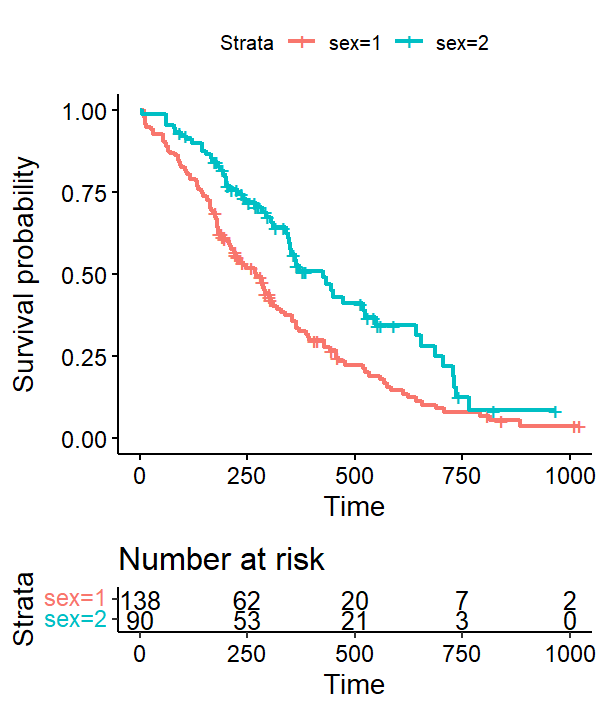
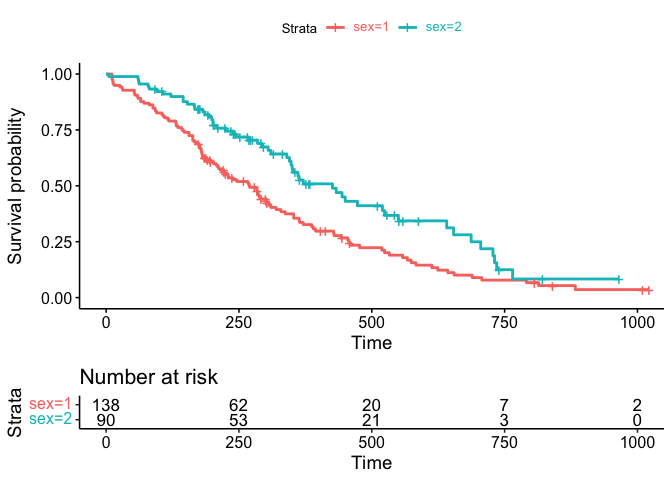
fit <- survfit(Surv(time, status) ~ sex, data = lung)
fitgraph <- ggsurvplot(fit,
                       risk.table = TRUE, risk.table.y.text.col = TRUE)
fitgraph
我真正想做的是改变图例上文字的颜色,使之与图表上线条的颜色相匹配。
使用这个来自into的previous solution,我可以将ggsurvket$绘图转换为一个grob,更改图例文本的颜色,然后将它转换回一个ggplot对象,它工作得很好.
g1 <- fitgraph

pGrob <- ggplotGrob(g1$plot)
g.b   <- pGrob[["grobs"]][[which(pGrob$layout$name=="guide-box")]]
l     <- g.b[[1]][[1]][["grobs"]]
# get grobs for legend symbols (extract color)
lg    <- l[sapply(l, function(i) grepl("GRID.segments", i))]
clr   <- mapply(FUN=function(x){x$gp$col},x=lg)

gb  <- which(grepl("guide-box", pGrob$layout$name))
gb2 <- which(grepl("guides", pGrob$grobs[[gb]]$layout$name))
label_text <- which(grepl("label",pGrob$grobs[[gb]]$grobs[[gb2]]$layout$name))

pGrob$grobs[[gb]]$grobs[[gb2]]$grobs[label_text] <-
  mapply(FUN = function(x, y) {x[["children"]][[1]][["children"]][[1]]$gp <- gpar(col =y); return(x)},
         x =   pGrob$grobs[[gb]]$grobs[[gb2]]$grobs[label_text],
         y =  clr, SIMPLIFY = FALSE)
grid.draw(pGrob)
然后将其转换回ggplot对象,将图形图例文本的颜色更改为与所需的线条颜色相匹配。
plot1 <- as.ggplot(pGrob)
plot1
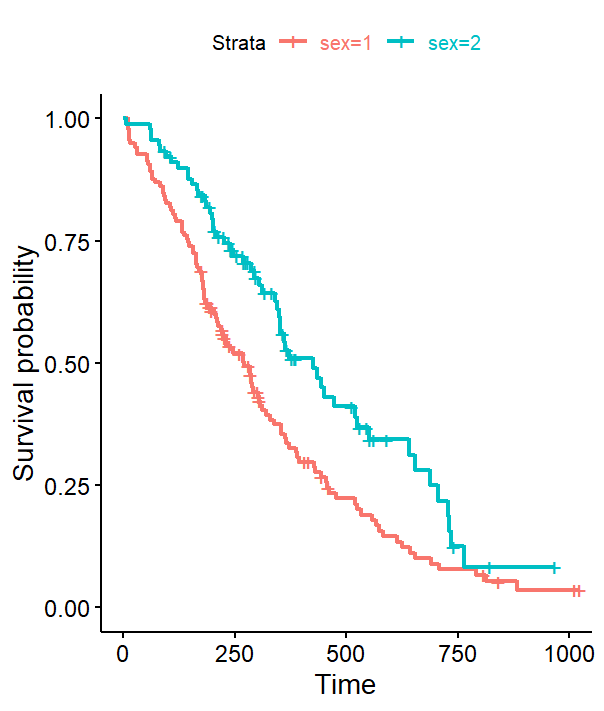
现在我被困的地方是将它与下面的原始ggsurvplot表集成起来,就像在第一个图中一样。
我最基本的反应是简单地将ggsurvket$绘图替换为在将原始地块提取到grob之后创建的新ggplot对象,然后再返回到ggplot.
g1$plot <- plot1但是这行不通..。
[.data.frame中的错误(g$data[1],"colour"):选中的未定义列
很可能是由于上述过程中的底层数据丢失,只存储了一个2x2表.
plot1$data
  x y
1 0 0
2 1 1与原始的fitgraph$plot$data相比,它产生了整个数据集(数百行,持续的生存比例),这些数据集可能是为风险表提供的。plot1 + fitgraph$table的另一种愚蠢策略也不起作用。
一定有更好的策略--有什么想法吗?提前感谢!
由于Stefan提供了下面的ggtext解决方案,所以编辑了,但是我的每个ggtext图都有一个不同的颜色方案,而应用这种方法似乎是过激的。
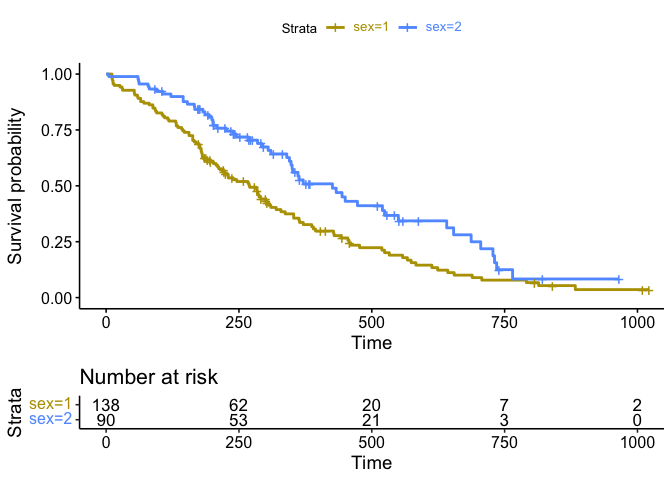
fit <- survfit(Surv(time, status) ~ sex, data = lung)
fitgraph <- ggsurvplot(fit,
                       risk.table = TRUE,
                       palette=c("#B79F00", "#619CFF"),
                       risk.table.col = "strata")
看上去像..。
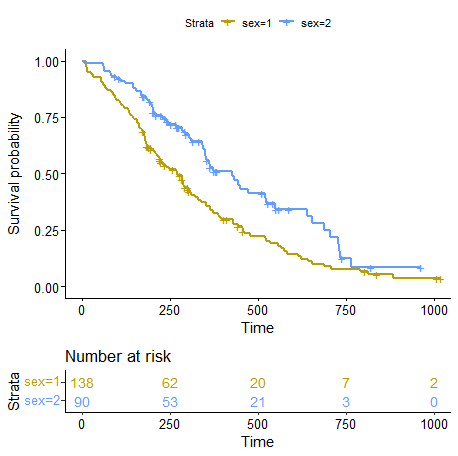
看起来不错,但是当我应用这个方法改变图例颜色时.
cols <- c("#B79F00", "#619CFF")

labels <- function(x, cols) {
  glue::glue("<span style = 'color: {cols}'>{x}</span>")
}

fitgraph$plot <- fitgraph$plot +
  scale_color_discrete(labels = ~labels(.x, cols)) +
  theme(legend.text = element_markdown())

fitgraph
这会导致原始图形颜色的丢失.
Scale for 'colour' is already present. Adding another scale for 'colour', which will replace the existing scale.
有什么想法吗?再次感谢..。
回答 1
Stack Overflow用户
发布于 2022-08-13 11:32:16
虽然我感谢您的努力,但是ggtext包提供了一个简单的选项来实现您想要的结果。除了使设置图例文本颜色更容易,最后的结果还可以简单地分配回ggurvplot对象的ggurvplot元素:
library(survival)
library(survminer)
library(ggtext)

fit <- survfit(Surv(time, status) ~ sex, data = lung)
fitgraph <- ggsurvplot(fit, risk.table = TRUE, risk.table.y.text.col = TRUE)

cols <- scales::hue_pal()(2)

labels <- function(x, cols) {
  glue::glue("<span style = 'color: {cols}'>{x}</span>")
}

fitgraph$plot <- fitgraph$plot +
  scale_color_discrete(labels = ~labels(.x, cols)) +
  theme(legend.text = element_markdown())

fitgraph
更新,如果您传递自定义调色板,我们必须切换到scale_color_manual并将颜色传递给values参数。一个缺点是,在这种情况下,当我们替换已经存在的scale_color_manual时,我们会得到一个警告
library(survival)
library(survminer)
library(ggtext)

cols <- c("#B79F00", "#619CFF")

fit <- survfit(Surv(time, status) ~ sex, data = lung)
fitgraph <- ggsurvplot(fit, risk.table = TRUE, risk.table.y.text.col = TRUE, palette=cols)

labels <- function(x, cols) {
  glue::glue("<span style = 'color: {cols}'>{x}</span>")
}

fitgraph$plot <- fitgraph$plot +
  scale_color_manual(values = cols, labels = ~labels(.x, cols)) +
  theme(legend.text = element_markdown())
#> Scale for 'colour' is already present. Adding another scale for 'colour',
#> which will replace the existing scale.

fitgraph
https://stackoverflow.com/questions/73331493
复制相似问题
腾讯云开发者
