
在R中使用GGplot的直方图中的数据标签
在R中使用GGplot的直方图中的数据标签
提问于 2022-08-14 20:44:41
在这里,我试图用下面两行代码来绘制图形。
ggplot(Melvyl,aes(x=Type.of.Customer)) +
  geom_histogram(stat="count")
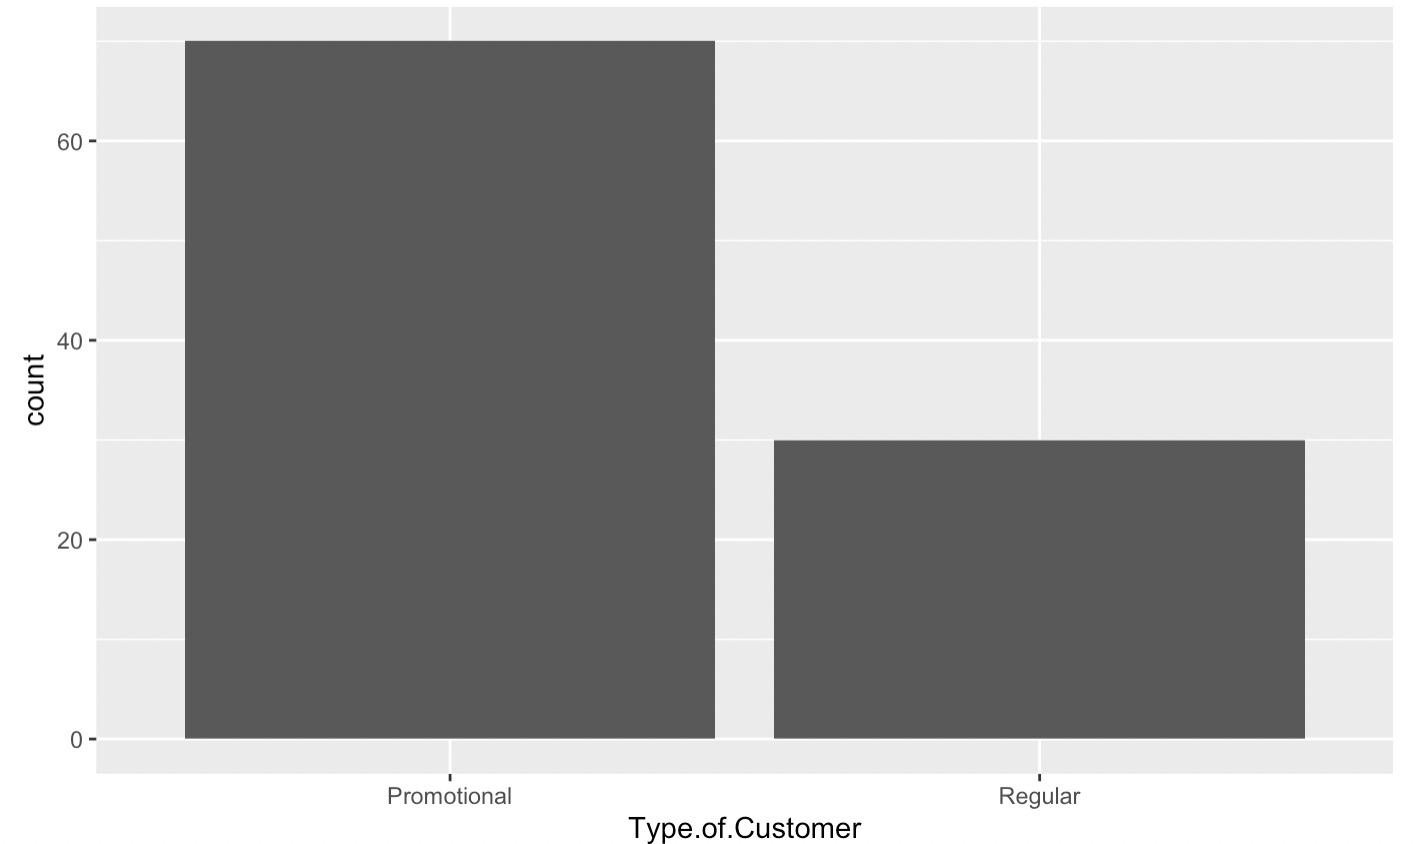
但我想要数据标签或计数的每一个类别,尝试下面的代码,但它不能工作。你能帮帮我吗!谢谢
ggplot(Melvyl,aes(x=Type.of.Customer)) +
geom_histogram(stat="count")+ stat_bin(binwidth=1, geom="text", aes(label=..count..), vjust=-1.5) 回答 1
Stack Overflow用户
回答已采纳
发布于 2022-08-14 20:54:01
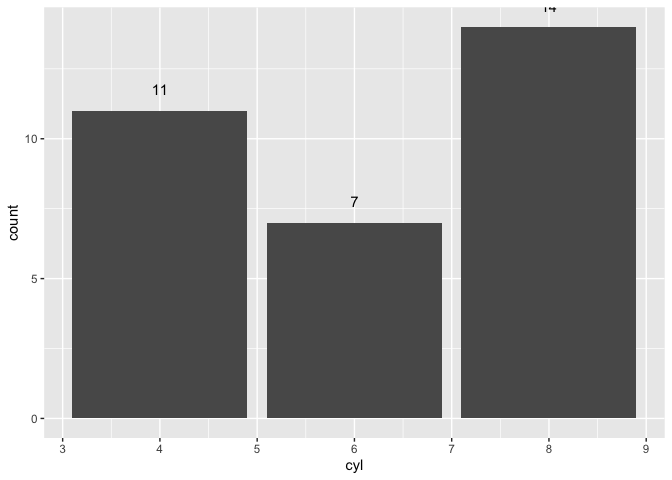
您可以继续使用geom_histogram,而不是使用geom_bar。要添加标签,请使用geom_text和stat="count"。
使用mtcars作为示例数据:
library(ggplot2)

ggplot(mtcars, aes(x=cyl)) +
  geom_bar() +
  geom_text(aes(label=..count..), stat = "count", vjust=-1.5)
页面原文内容由Stack Overflow提供。腾讯云小微IT领域专用引擎提供翻译支持
原文链接:
https://stackoverflow.com/questions/73355003
复制相关文章
相似问题
腾讯云开发者
