
Matplotlib fill_between反转?
Matplotlib fill_between反转?
提问于 2022-08-22 16:03:54
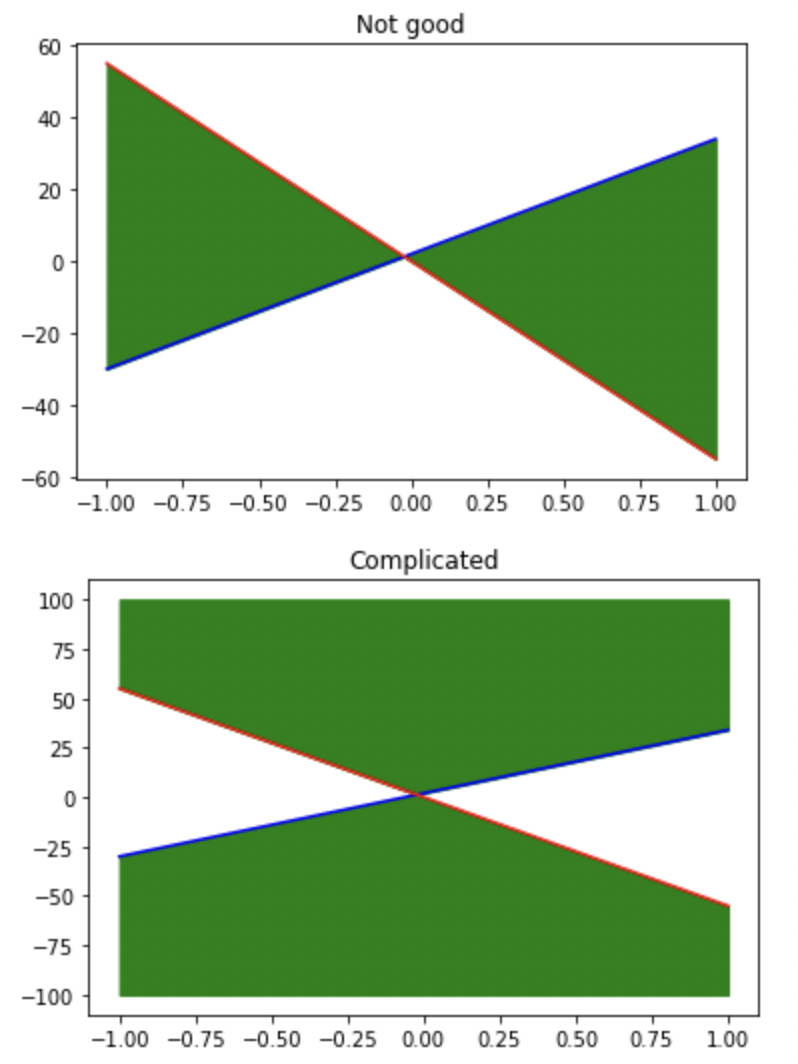
我试图使用matplotlib填充两条相交线下面的区域和两条线之上的区域。我可以在两条线之间填充,但还没有找到一种简单的方法来反演以前得到的区域。我唯一的解决办法是创建一些额外的函数(底部是一个低的函数,一个是最小的函数,而顶部的是对应的函数),这有点麻烦,需要手动输入(见下文)。有更好的解决办法吗?
import numpy as np
import matplotlib.pyplot as plt

# Doesn't work
def f1(x): return 32.0 * x + 2.0
def f2(x): return -55.0 * x
xRng=[-1, 1]
plt.plot(xRng, [f1(x) for x in xRng], 'b-')
plt.plot(xRng, [f2(x) for x in xRng], 'r-')
plt.fill_between(xRng, [f1(x) for x in xRng], [f2(x) for x in xRng], color='g') # Would like the fill inverted
plt.title('Not good'); plt.show()

# Works, but clumsy
def fLo(x): return -100
def fHi(x): return 100
def fMin(x): return min(f1(x), f2(x))
def fMax(x): return max(f1(x), f2(x))
xRng=np.linspace(-1, 1, 100)
plt.plot(xRng, [f1(x) for x in xRng], 'b-')
plt.plot(xRng, [f2(x) for x in xRng], 'r-')
plt.fill_between(xRng, [fMin(x) for x in xRng], [fLo(x) for x in xRng], color='g')
plt.fill_between(xRng, [fMax(x) for x in xRng], [fHi(x) for x in xRng], color='g')
plt.title('Complicated'); plt.show()
编辑:根据@Mad物理学家的建议,交换BG和FG的颜色,如果是基本情况,就会起作用,但如果有几个这样的区域要覆盖,则不起作用。
Stack Overflow用户
回答已采纳
发布于 2022-08-22 16:28:34
看来fill_between在无限值(例如Fill area under curve in matlibplot python on log scale)方面做得不好。但是,如果您只想绘制这些特定的线条,则只需将情节的颜色反转:
import numpy as np
import matplotlib.pyplot as plt

x = np.linspace(-1, 1, 100)
y1 = 32.0 * x + 2.0
y2 = -55.0 * x

fig, ax = plt.subplots()
ax.set_facecolor('g')
ax.plot(x, y1, 'b-')
ax.plot(x, y2, 'r-')
ax.fill_between(x, y1, y2, color='w')
ax.set_xlim(x.min(), x.max())
plt.show()
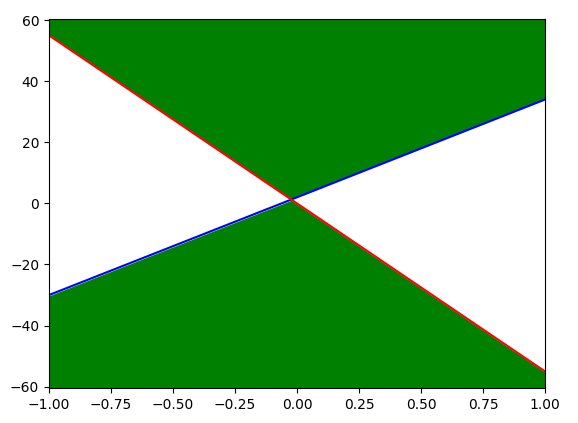
这是非常麻烦的,不会很好地与互动的情节,但它将显示你想要的情节,希望相当轻松。
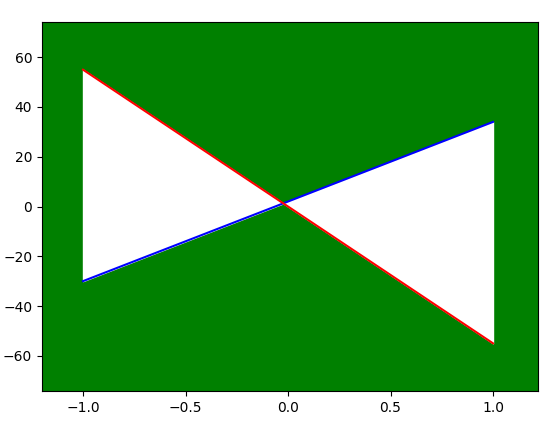
一种稍微好一些的方法可能是将x覆盖的区域的背景设置为绿色补丁:
import numpy as np
import matplotlib.pyplot as plt

x = np.linspace(-1, 1, 100)
y1 = 32.0 * x + 2.0
y2 = -55.0 * x

fig, ax = plt.subplots()
ax.plot(x, y1, 'b-')
ax.plot(x, y2, 'r-')
ax.axvspan(x.min(), x.max(), color='g')
ax.fill_between(x, y1, y2, color='w')
ax.set_xlim(x.min(), x.max())
plt.show()

页面原文内容由Stack Overflow提供。腾讯云小微IT领域专用引擎提供翻译支持
原文链接:
https://stackoverflow.com/questions/73447993
复制相关文章
相似问题
腾讯云开发者

Copyright © 2013 - 2026 Tencent Cloud. All Rights Reserved. 腾讯云 版权所有
深圳市腾讯计算机系统有限公司 ICP备案/许可证号:粤B2-20090059 ![]() 粤公网安备44030502008569号
粤公网安备44030502008569号
腾讯云计算(北京)有限责任公司 京ICP证150476号 | 京ICP备11018762号