
如何在数据帧中为文本添加上标?
如何在数据帧中为文本添加上标?
提问于 2022-08-24 19:44:14
我试图养成用R制作表格的习惯,而不是用MS“手工”制作表格。如何使我的文本在数据框架内被迷信?
示例数据:
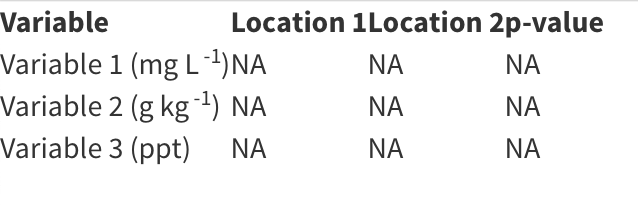
df <- data.frame(matrix(ncol = 4, nrow = 3))
colnames(df)[1:4] <- c("Variable","Location 1","Location 2","p-value")
df$Variable <- c("Variable 1 (mg L<sup> -1</sup>)",
                 "Variable 2 (g kg<sup> -1</sup>)",
                 "Variable 3 (ppt)")
View(df)
我也尝试了下面的表示法,但也不起作用。
df <- data.frame(matrix(ncol = 4, nrow = 3))
colnames(df)[1:4] <- c("Variable","Location 1","Location 2","p-value")
df$Variable <- c(expression(paste("Variable 1 (mg   ",  L^-1,")")),
                 expression(paste("Variable 2 (g   ",  kg^-1,")")),
                 "Variable 3 (ppt)")
View(df)回答 2
Stack Overflow用户
回答已采纳
发布于 2022-08-24 20:11:44
Stack Overflow用户
发布于 2022-08-24 20:19:17
可以在支持unicode字符的范围内使用unicode字符。在Windows上使用R4.2.1的Rgui R控制台上,这对我起了作用。
df <- data.frame(Variable = c("Variable 1 (mg L\u207b\u00b9)",
                              "Variable 2 (g kg\u207b\u00b9)",
                              "Variable 3 (ppt)"))
df$"Location 1" <- df$"Location 2" <- df$pvalue <- NA

df
给予:
             Variable Location 1 Location 2  pvalue
1 Variable 1 (mg L⁻¹)         NA         NA      NA
2 Variable 2 (g kg⁻¹)         NA         NA      NA
3 Variable 3 (ppt) NA NA NA页面原文内容由Stack Overflow提供。腾讯云小微IT领域专用引擎提供翻译支持
原文链接:
https://stackoverflow.com/questions/73478773
复制相关文章
相似问题
腾讯云开发者
