
如何使比特图将unix毫秒时间戳识别为x轴?
我终于完成了两个月在PyQt5中复制烛台图表的努力。除了设置适当的滚动视图界限之外,我需要更重要地配置图表以显示日期和时间,而不是底部显示0、1、2、3、4等。我从MT5的python中获得数据。
unix时间是一个整数数据类型,价格不幸是一个浮点数据类型,所以我不得不对我的数组略带创意。
我使用的是纯的numpy数组,因为熊猫的速度要慢得多,而且出于同样的原因,我希望避免结构化数组,因此我在一个单独的数组中为每个条形添加了unix时间,与价格数组的索引数相同。如果有更好的方法告诉我。
我当前的问题是,当我应用时,pyqtgraph绘图不识别数据。
axis = pg.DateAxisItem(orientation='bottom')
plt.setAxisItems({"bottom": axis})
由于缺乏文档,所以我不确定我做错了什么。我假设它可能与CandlestickItem类中的“width”参数有关,因为我认为它还没有转换为datetime,但如果是这样的话,我不知道该怎么办。文档说它需要一个unix时间戳,但它只是加载一个空的地块。
我很难在网上找到任何能帮助我的例子。有人能给我指明正确的方向吗?
import pyqtgraph as pg
import numpy as np
from PyQt5 import QtWidgets, QtCore, QtGui
from pyqtgraph import PlotWidget, plot, QtCore, QtGui
import sys
import time
import threading
import os
import queue
import MetaTrader5 as mt5
from datetime import datetime
from time import sleep
import math

# ------------------------------------------------------------------------------

'''chart items'''


class CandlestickItem(pg.GraphicsObject):

    _boundingRect = QtCore.QRectF()

    # ...
    def __init__(self):
        pg.GraphicsObject.__init__(self)
        self.picture = QtGui.QPicture()
        self.flagHasData = False


    def set_data(self, *data):
        self.old_data, self.current_data, self.time_data = data
        self.flagHasData = True
        self.generatePicture()
        self.informViewBoundsChanged()


    def generatePicture(self):

# update previous candles

        self.picture = QtGui.QPicture()

        path = QtGui.QPainterPath()
        p = QtGui.QPainter(self.picture)
        p.setPen(pg.mkPen('w'))
        width = (self.time_data[1] - self.time_data[0] / 3)

        for (number, open, close) in self.old_data:
            time = self.time_data[len(self.old_data)-1]
            rect = QtCore.QRectF(time - width, open, width * 2, close - open)
            path.addRect(rect)
            # print(rect)

            if open > close:
                p.setBrush(pg.mkBrush('r'))
            else:
                p.setBrush(pg.mkBrush('g'))
            p.drawRect(rect)
# ------------------------------------------------------------------------------
# update currently active candle
        path2 = QtGui.QPainterPath()

        for (number, open, close) in self.current_data[[len(self.current_data)-1]]:
            time = self.time_data[len(self.old_data)-1]
            rect2 = QtCore.QRectF(time - width, open, width * 2, close - open)
            path2.addRect(rect2)
            if open > close:
                p.setBrush(pg.mkBrush('r'))
            else:
                p.setBrush(pg.mkBrush('g'))
            p.drawRect(rect2)
        p.end()
        self._boundingRect = path.boundingRect()

    def paint(self, p, *args):

        if self.flagHasData:
            p.drawPicture(0, 0, self.picture)


    def boundingRect(self):
        return self._boundingRect

# ------------------------------------------------------------------------------


# establish connection to the MetaTrader 5 terminal
if not mt5.initialize():
    print("initialize() failed, error code =", mt5.last_error())
    quit()

# attempt to enable the display of the EURUSD in MarketWatch
selected = mt5.symbol_select("EURUSD", True)
if not selected:
    print("Failed to select EURUSD")
    mt5.shutdown()
    quit()


# ------------------------------------------------------------------------------


class Candle_type_handler:
#loads arrays and threads
    def __init__(self, func_list=None, *args):
        self.tick_counter = 1
        self.bar_counter = 1
        self.last_tick = 0
        self.last_bar = 0
        self.current_tick = mt5.symbol_info_tick("EURUSD")
        self.open_value = self.current_tick[1]

        self.chart_array = np.zeros((100000, 3), dtype=float)
        self.chart_array[0, 1] = self.current_tick[1]
        self.chart_array[0, 2] = self.current_tick[1]
        self.chart_array[1, 1] = self.current_tick[1]
        self.chart_array[1, 2] = self.current_tick[1]

        self.candle_array = np.zeros((100000, 3), dtype=float)
        self.candle_array[0, 1] = self.current_tick[1]
        self.candle_array[0, 2] = self.current_tick[1]

        self.tick_timestamp = np.zeros((100000, 1), dtype= np.int64)
        self.tick_timestamp[0] = self.current_tick[5]
        self.tick_timestamp[1] = self.current_tick[5]

        self.last_old_candle_data = self.chart_array[:2]
        self.last_new_candle_data = self.candle_array[:2]
        self.last_time_data = self.tick_timestamp[:2]

        t1 = threading.Thread(target=self.update_newest_ticks, args=())
        t1.start()
        t2 = threading.Thread(target=self.timer, args=())
        t2.start()
        t3 = threading.Thread(target=self.update_chart, args=())
        t3.start()


    def timer(self):
    #waits 30 seconds before loading a new bar

        time.sleep(30)
        self.update_candle()

        self.timer()

    def update_newest_ticks(self, *args):
    #handles data for the current active bar

        last_bar = 0
        current_bar = 0
        open_value = 0
        current_tick = 0

        self.current_tick = mt5.symbol_info_tick("EURUSD")

        while True:
            self.current_tick = mt5.symbol_info_tick("EURUSD")

            #if tick value has changed update the array and put values into queue
            if self.last_tick != self.current_tick:
                self.last_tick = self.current_tick
                # self.tick_timestamp[self.tick_counter] = self.current_tick[5]
                self.candle_array[self.tick_counter, 0], self.candle_array[self.tick_counter, 1], self.candle_array[self.tick_counter, 2] = self.bar_counter , self.open_value, self.current_tick[1]
                self.tick_counter += 1
                newtick.put(self.candle_array[:self.tick_counter])


            else:
                pass

    def update_candle(self):
    #handles data for all of the previous bars

        self.current_tick = mt5.symbol_info_tick("EURUSD")
        self.tick_timestamp[self.bar_counter] = self.current_tick[5]
        self.chart_array[self.bar_counter, 0], self.chart_array[self.bar_counter, 1], self.chart_array[self.bar_counter, 2] = self.bar_counter, self.chart_array[self.bar_counter - 1, 2], self.current_tick[1]
        self.bar_counter += 1
        self.open_value = self.current_tick[1]
        newbar.put([self.chart_array[:self.bar_counter], self.tick_timestamp[:self.bar_counter]])


    def update_chart(self):
    #pushes bar and tick data into the plot

        while True:

            #check if queues are empty, if not use current data, if so use last known data

            if newtick.empty() == False and newbar.empty() == True:
                n = newtick.get()
                self.last_new_candle_data = n
                item.set_data(self.last_old_candle_data, n, self.last_time_data)
                newtick.task_done()

            elif newtick.empty() == True and newbar.empty() == False:
                o, t = newbar.get()
                self.last_old_candle_data = o
                self.last_time_data = t
                item.set_data(o, self.last_new_candle_data, t)
                newbar.task_done()

            elif newtick.empty() == False and newbar.empty() == False:
                n = newtick.get()
                o, t = newbar.get()
                self.last_old_candle_data = o
                self.last_new_candle_data = n
                self.last_time_data = t

                item.set_data(o, n, t)
                newtick.task_done()
                newbar.task_done()

            else:
                pass


app = QtWidgets.QApplication([])
item = CandlestickItem()

plt = pg.plot()
plt.addItem(item)
plt.setWindowTitle('pyqtgraph example: customGraphicsItem')


axis = pg.DateAxisItem(orientation='bottom')
plt.setAxisItems({"bottom": axis})

newtick = queue.Queue()
newbar = queue.Queue()

candle_type_handler = Candle_type_handler()


# ------------------------------------------------------------------------------

if __name__ == '__main__':
    # window = Window()
    import sys

    if (sys.flags.interactive != 1) or not hasattr(QtCore, 'PYQT_VERSION'):
        QtWidgets.QApplication.instance().exec_()
unix时间戳数据在运行时如下所示
[1661821590775]
[1661821590775]
[1661821590775]
[1661821590775]
[1661821590775]
[1661821590775]
[1661821616674]
[1661821616674]
[1661821616674]
[1661821616674]
[1661821616674]
[1661821616674]
价格数据如下所示
   new bar
[[0.      1.00015 1.00015]
 [1.      1.00015 1.00015]]
new bar
[[0.      1.00015 1.00015]
 [1.      1.00015 1.00015]
 [1.      1.00015 1.00014]]
new bar
[[0.      1.00015 1.00015]
 [1.      1.00015 1.00015]
 [1.      1.00015 1.00014]
 [1.      1.00015 1.00015]]
old bars
----------------------------------------------
[[0.      1.00015 1.00015]
 [1.      1.00015 1.00015]]
new bar
[[0.      1.00015 1.00015]
 [1.      1.00015 1.00015]
 [1.      1.00015 1.00014]
 [1.      1.00015 1.00015]
 [2.      1.00015 1.00014]]
new bar
[[0.      1.00015 1.00015]
 [1.      1.00015 1.00015]
 [1.      1.00015 1.00014]
 [1.      1.00015 1.00015]
 [2.      1.00015 1.00014]
 [2.      1.00015 1.00013]]
new bar
[[0.      1.00015 1.00015]
 [1.      1.00015 1.00015]
 [1.      1.00015 1.00014]
 [1.      1.00015 1.00015]
 [2.      1.00015 1.00014]
 [2.      1.00015 1.00013]
 [2.      1.00015 1.00014]]
new bar
[[0.      1.00015 1.00015]
 [1.      1.00015 1.00015]
 [1.      1.00015 1.00014]
 [1.      1.00015 1.00015]
 [2.      1.00015 1.00014]
 [2.      1.00015 1.00013]
 [2.      1.00015 1.00014]
 [2.      1.00015 1.00013]]
old bars
----------------------------------------------
[[0.      1.00015 1.00015]
 [1.      1.00015 1.00015]
 [2.      1.00015 1.00013]]
new bar
[[0.      1.00015 1.00015]
 [1.      1.00015 1.00015]
 [1.      1.00015 1.00014]
 [1.      1.00015 1.00015]
 [2.      1.00015 1.00014]
 [2.      1.00015 1.00013]
 [2.      1.00015 1.00014]
 [2.      1.00015 1.00013]
 [3.      1.00013 1.00014]]
new bar
[[0.      1.00015 1.00015]
 [1.      1.00015 1.00015]
 [1.      1.00015 1.00014]
 [1.      1.00015 1.00015]
 [2.      1.00015 1.00014]
 [2.      1.00015 1.00013]
 [2.      1.00015 1.00014]
 [2.      1.00015 1.00013]
 [3.      1.00013 1.00014]
 [3.      1.00013 1.00013]]
old bars
----------------------------------------------
在“旧酒吧”是以前的,静态蜡烛和“新酒吧”是目前的活动蜡烛,但尚未关闭。“新酒吧”总是在“旧酒吧”之前的一个酒吧。
行左侧的0,1,2等表示该数据的条号,unix数组索引与“旧条形”数据数组中的索引对齐,这样就可以同等地引用它。
这里要求的编辑是静态数据的一个变化。
import pyqtgraph as pg
from pyqtgraph import QtCore, QtGui, QtWidgets
import numpy as np
data = np.array([ ## fields are (time, open, close, min, max).
(1661872308774, 10, 13),
(1661872336582, 13, 17),
(1661872368026, 17, 14),
(1661872397661, 14, 15),
(1661872428131, 15, 9),
(1661872455602, 9, 15),
(1661872488274, 15, 5),
(1661872518657, 5, 7),
(1661872549187, 7, 3),
(1661872577460, 3, 10),
(1661872606823, 10, 15),
(1661872639411, 15, 25),
(1661872669708, 25, 20),
(1661872700345, 20, 17),
(1661872725885, 17, 30),
(1661872760392, 30, 32),
(1661872789563, 32, 35),
(1661872820816, 35, 28),
(1661872849628, 28, 27),
(1661872880335, 27, 25),
(1661872910454, 25, 29),
(1661872940708, 29, 35),
(1661872971391, 35, 40),
(1661873001600, 40, 45),
])
class CandlestickItem(pg.GraphicsObject):
global data
_boundingRect = QtCore.QRectF()
# ...
def __init__(self):
pg.GraphicsObject.__init__(self)
self.flagHasData = False
def set_data(self, data):
self.data = data
self.flagHasData = True
self.generatePicture()
self.informViewBoundsChanged()
def generatePicture(self):
self.picture = QtGui.QPicture()
path = QtGui.QPainterPath()
p = QtGui.QPainter(self.picture)
p.setPen(pg.mkPen('w'))
w = (self.data[1][0] - self.data[0][0]) / 3.
for (t, open, close) in self.data:
rect = QtCore.QRectF(t-w, open, w*2, close-open)
path.addRect(rect)
if open > close:
p.setBrush(pg.mkBrush('r'))
else:
p.setBrush(pg.mkBrush('g'))
p.drawRect(rect)
p.end()
self._boundingRect = path.boundingRect()
def paint(self, p, *args):
if self.flagHasData:
p.drawPicture(0, 0, self.picture)
# def boundingRect(self):
# return self._boundingRect
def boundingRect(self):
# data =data
# xmin = np.nanmin(data[:,0])
xmax = np.nanmax(data[:,0])
xmin = xmax - 5
ymin = np.nanmin(data[:,2])
ymax = np.nanmax(data[:,2])
return QtCore.QRectF(xmin, ymin, xmax-xmin, ymax-ymin)
item = CandlestickItem()
plt = pg.plot()
plt.setMouseEnabled(x=True, y=False)
plt.addItem(item)
plt.setWindowTitle('pyqtgraph example: customGraphicsItem')
item.set_data(data)
axis = pg.DateAxisItem(orientation='bottom')
plt.setAxisItems({"bottom": axis})
if __name__ == '__main__':
import sys
if (sys.flags.interactive != 1) or not hasattr(QtCore, 'PYQT_VERSION'):
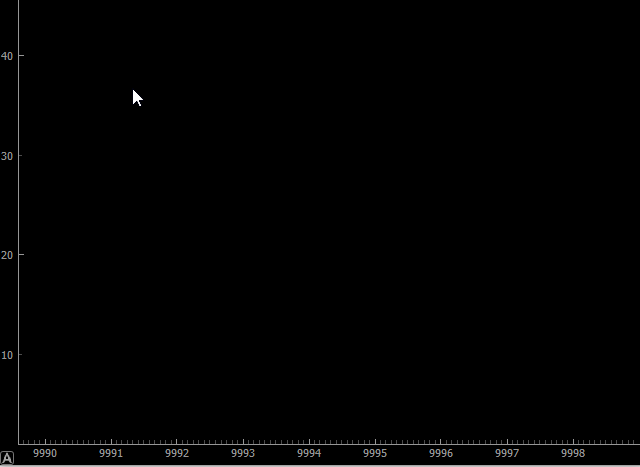
QtWidgets.QApplication.instance().exec_()编辑2:
即使我把unix除以1000000,它仍然显示9995年,而不是2022年。
import pyqtgraph as pg
from pyqtgraph import QtCore, QtGui, QtWidgets
import numpy as np

data = np.array([  ## fields are (time, open, close, min, max).
    (1661872308774, 10, 13),
    (1661872336582, 13, 17),
    (1661872368026, 17, 14),
    (1661872397661, 14, 15),
    (1661872428131, 15, 9),
    (1661872455602, 9, 15),
    (1661872488274, 15, 5),
    (1661872518657, 5, 7),
    (1661872549187, 7, 3),
    (1661872577460, 3, 10),
    (1661872606823, 10, 15),
    (1661872639411, 15, 25),
    (1661872669708, 25, 20),
    (1661872700345, 20, 17),
    (1661872725885, 17, 30),
    (1661872760392, 30, 32),
    (1661872789563, 32, 35),
    (1661872820816, 35, 28),
    (1661872849628, 28, 27),
    (1661872880335, 27, 25),
    (1661872910454, 25, 29),
    (1661872940708, 29, 35),
    (1661872971391, 35, 40),
    (1661873001600, 40, 45),
])


class CandlestickItem(pg.GraphicsObject):
    global data
    _boundingRect = QtCore.QRectF()


    # ...
    def __init__(self):
        pg.GraphicsObject.__init__(self)
        self.flagHasData = False


    def set_data(self, data):
        self.data = data
        self.flagHasData = True
        self.generatePicture()
        self.informViewBoundsChanged()


    def generatePicture(self):
        self.picture = QtGui.QPicture()


        path = QtGui.QPainterPath()
        p = QtGui.QPainter(self.picture)
        p.setPen(pg.mkPen('w'))
        w = (self.data[1][0] - self.data[0][0]) / 3.
        for (t, open, close) in self.data:

            time = int(t/1000000)


            print(time)

            rect = QtCore.QRectF(time-w, open, w*2, close-open)
            path.addRect(rect)

            if open > close:
                p.setBrush(pg.mkBrush('r'))
            else:
                p.setBrush(pg.mkBrush('g'))
            p.drawRect(rect)

        p.end()
        self._boundingRect = path.boundingRect()

    def paint(self, p, *args):
        if self.flagHasData:
            p.drawPicture(0, 0, self.picture)

    # def boundingRect(self):
    #     return self._boundingRect

    def boundingRect(self):
        # data =data
        # xmin = np.nanmin(data[:,0])
        xmax = np.nanmax(data[:,0])
        xmin = xmax - 5
        ymin = np.nanmin(data[:,2])
        ymax = np.nanmax(data[:,2])
        return QtCore.QRectF(xmin, ymin, xmax-xmin, ymax-ymin)

item = CandlestickItem()
plt = pg.plot()
plt.setMouseEnabled(x=True, y=False)
plt.addItem(item)
plt.setWindowTitle('pyqtgraph example: customGraphicsItem')
item.set_data(data)
axis = pg.DateAxisItem(orientation='bottom')
plt.setAxisItems({"bottom": axis})

if __name__ == '__main__':
    import sys
    if (sys.flags.interactive != 1) or not hasattr(QtCore, 'PYQT_VERSION'):
        QtWidgets.QApplication.instance().exec_()
回答 1
Stack Overflow用户
发布于 2022-09-01 17:58:06
至少在您的MRE中,问题在于linux时间戳。
pyqtgraph似乎正在很好地读取时间数据。只是你的时间戳太高了。
有了下面的数据和轴向范围的变化,我可以得到这个。
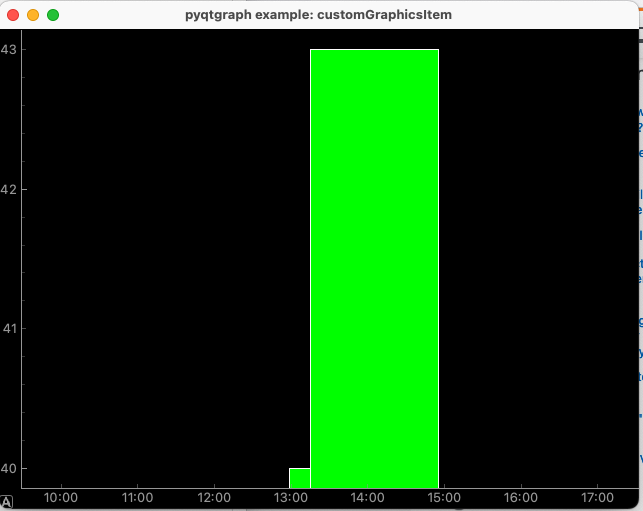
我与MRE一起使用的数据是
     (1662054508, 35, 40),
     (1662055508, 38, 43),
此外,您还可能希望通过将最小值移动到
np.nanmin(data[:,0]
or
np.nanargmax(data[:,0] - 5https://stackoverflow.com/questions/73535455
复制相似问题
腾讯云开发者
