
R图:我想看到w1 -6和其他1-6的不同颜色。
R图:我想看到w1 -6和其他1-6的不同颜色。
提问于 2022-09-02 12:50:00
docnames(s1) <- rep(c("other","w"), each=6)
tmod_ca <- textmodel_ca(s1)
textplot_scale1d(tmod_ca)
dat_ca <- data.frame(dim1 = coef(tmod_ca, doc_dim = 1)$coef_document,
dim2 = coef(tmod_ca, doc_dim = 2)$coef_document)
head(dat_ca)
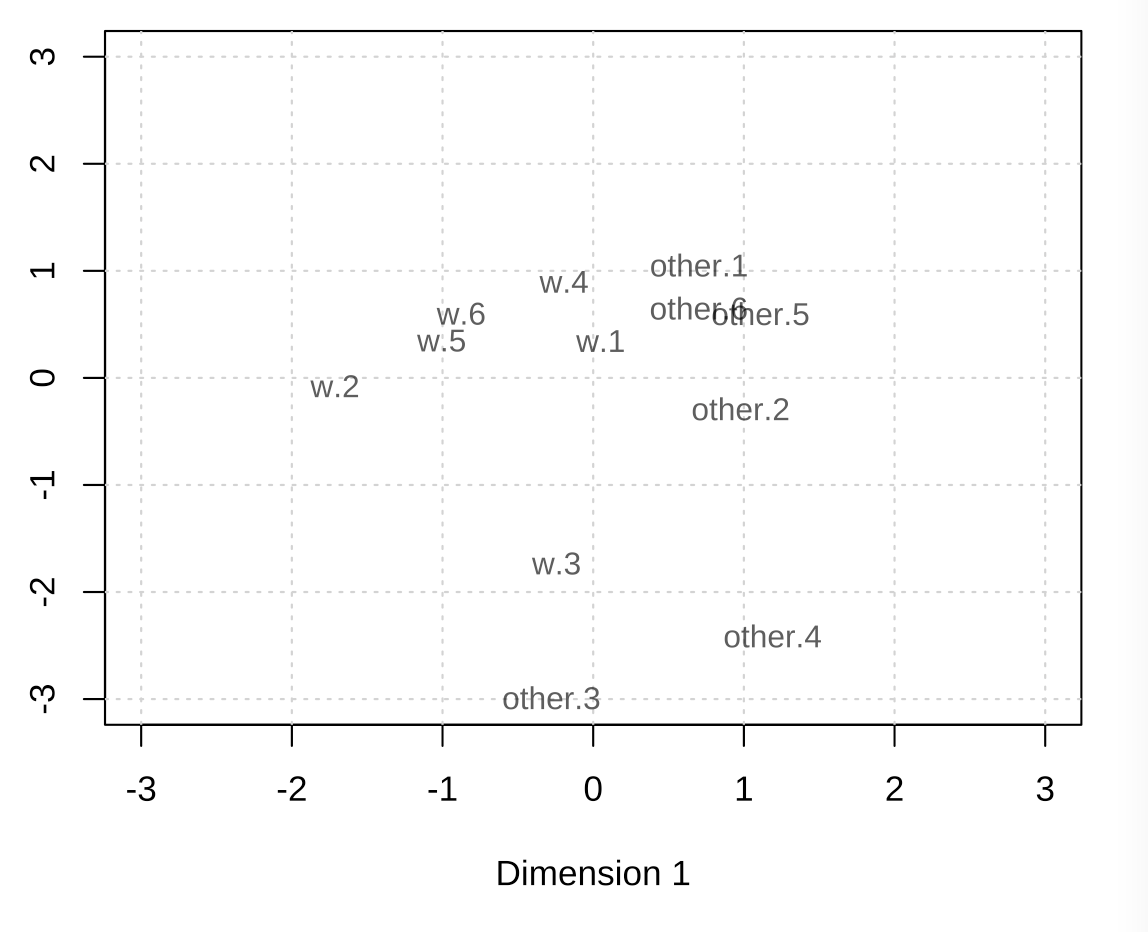
plot(1, xlim = c(-3, 3), ylim = c(-3, 3), type = "n", xlab = "Dimension 1", ylab = "Dimension 2")
grid()
text(dat_ca$dim1, dat_ca$dim2, labels = rownames(dat_ca), cex = 0.9, col = rgb(0, 0, 0, 0.7))
我想看w1 -6和other1 -6的不同颜色.我该怎么办?
回答 1
Stack Overflow用户
发布于 2022-09-02 13:10:28
我不能重现你的例子,但我创建了一个简单的例子:
data <- data.frame(
y = rnorm(12),
x = rnorm(12),
doc = rep(c("other","w"),each=6)
)然后,只需将参数col添加到函数test中,为每个条目提供颜色向量:
plot(data$x, data$y, type = "n")
text(data$x, data$y, data$doc, col = ifelse(grepl("other", data$doc), rgb(0, 0, 0, 0.7), rgb(0.5, 0.5, 0.5, 0.5)))
如果您更喜欢ggplot2绘图,则有以下代码:
require(ggplot2)
ggplot(data, aes(x = x, y = y)) + geom_text(aes(col = doc, label = doc))
希望这能有所帮助
页面原文内容由Stack Overflow提供。腾讯云小微IT领域专用引擎提供翻译支持
原文链接:
https://stackoverflow.com/questions/73582847
复制相关文章
相似问题
腾讯云开发者
