
从一个多类问题的SHAP摘要图中提取每个类的特征重要性
从一个多类问题的SHAP摘要图中提取每个类的特征重要性
提问于 2022-09-08 21:40:06
我想知道如何使用shap算法为特定类生成一个特性重要性表?
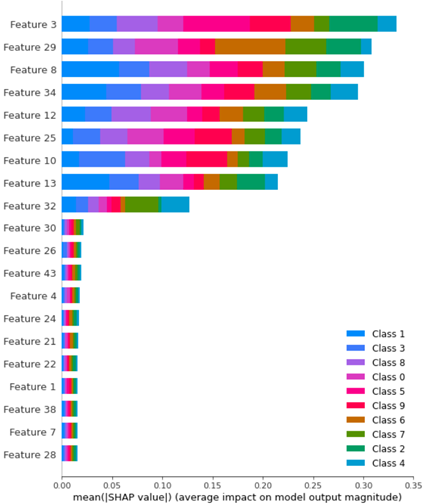
从上面的图中,如何提取仅6类的特性重要性?
我看到了here,对于二进制类问题,您可以通过以下方法提取每个类的shap:
# shap values for survival
sv_survive = sv[:,y,:]
# shap values for dying
sv_die = sv[:,~y,:]
如何使此代码符合多类问题的要求?
我需要提取与第6类特性重要性相关的shap值。
下面是我的代码的开头:
from sklearn.datasets import make_classification
import seaborn as sns
import numpy as np
import pandas as pd
from matplotlib import pyplot as plt
import pickle
import joblib
import warnings
import shap
from sklearn.ensemble import RandomForestClassifier
from sklearn.model_selection import RandomizedSearchCV, GridSearchCV

f, (ax1,ax2) = plt.subplots(nrows=1, ncols=2,figsize=(20,8))
# Generate noisy Data
X_train,y_train = make_classification(n_samples=1000,
                          n_features=50,
                          n_informative=9,
                          n_redundant=0,
                          n_repeated=0,
                          n_classes=10,
                          n_clusters_per_class=1,
                          class_sep=9,
                          flip_y=0.2,
                          #weights=[0.5,0.5],
                          random_state=17)

X_test,y_test = make_classification(n_samples=500,
                          n_features=50,
                          n_informative=9,
                          n_redundant=0,
                          n_repeated=0,
                          n_classes=10,
                          n_clusters_per_class=1,
                          class_sep=9,
                          flip_y=0.2,
                          #weights=[0.5,0.5],
                          random_state=17)

model = RandomForestClassifier()

parameter_space = {
    'n_estimators': [10,50,100],
    'criterion': ['gini', 'entropy'],
    'max_depth': np.linspace(10,50,11),
}

clf = GridSearchCV(model, parameter_space, cv = 5, scoring = "accuracy", verbose = True) # model
my_model = clf.fit(X_train,y_train)
print(f'Best Parameters: {clf.best_params_}')

# save the model to disk
filename = f'Testt-RF.sav'
pickle.dump(clf, open(filename, 'wb'))

explainer = Explainer(clf.best_estimator_)
shap_values_tr1 = explainer.shap_values(X_train)回答 1
Stack Overflow用户
回答已采纳
发布于 2022-09-09 17:53:06
让我们试试最小可重现性示例:
from sklearn.datasets import make_classification
from shap import Explainer, waterfall_plot, Explanation
from sklearn.ensemble import RandomForestClassifier
from sklearn.model_selection import train_test_split

# Generate noisy Data
X, y = make_classification(n_samples=1000,
                          n_features=50,
                          n_informative=9,
                          n_redundant=0,
                          n_repeated=0,
                          n_classes=10,
                          n_clusters_per_class=1,
                          class_sep=9,
                          flip_y=0.2,
                          random_state=17)
X_train, X_test, y_train, y_test = train_test_split(X, y, random_state=42)

model = RandomForestClassifier()
model.fit(X_train, y_train)

explainer = Explainer(model)
sv = explainer.shap_values(X_test)
我是说你可以通过以下方式达到你的目标:
cls = 9   # class to explain
sv_cls = sv[cls]
为什么?
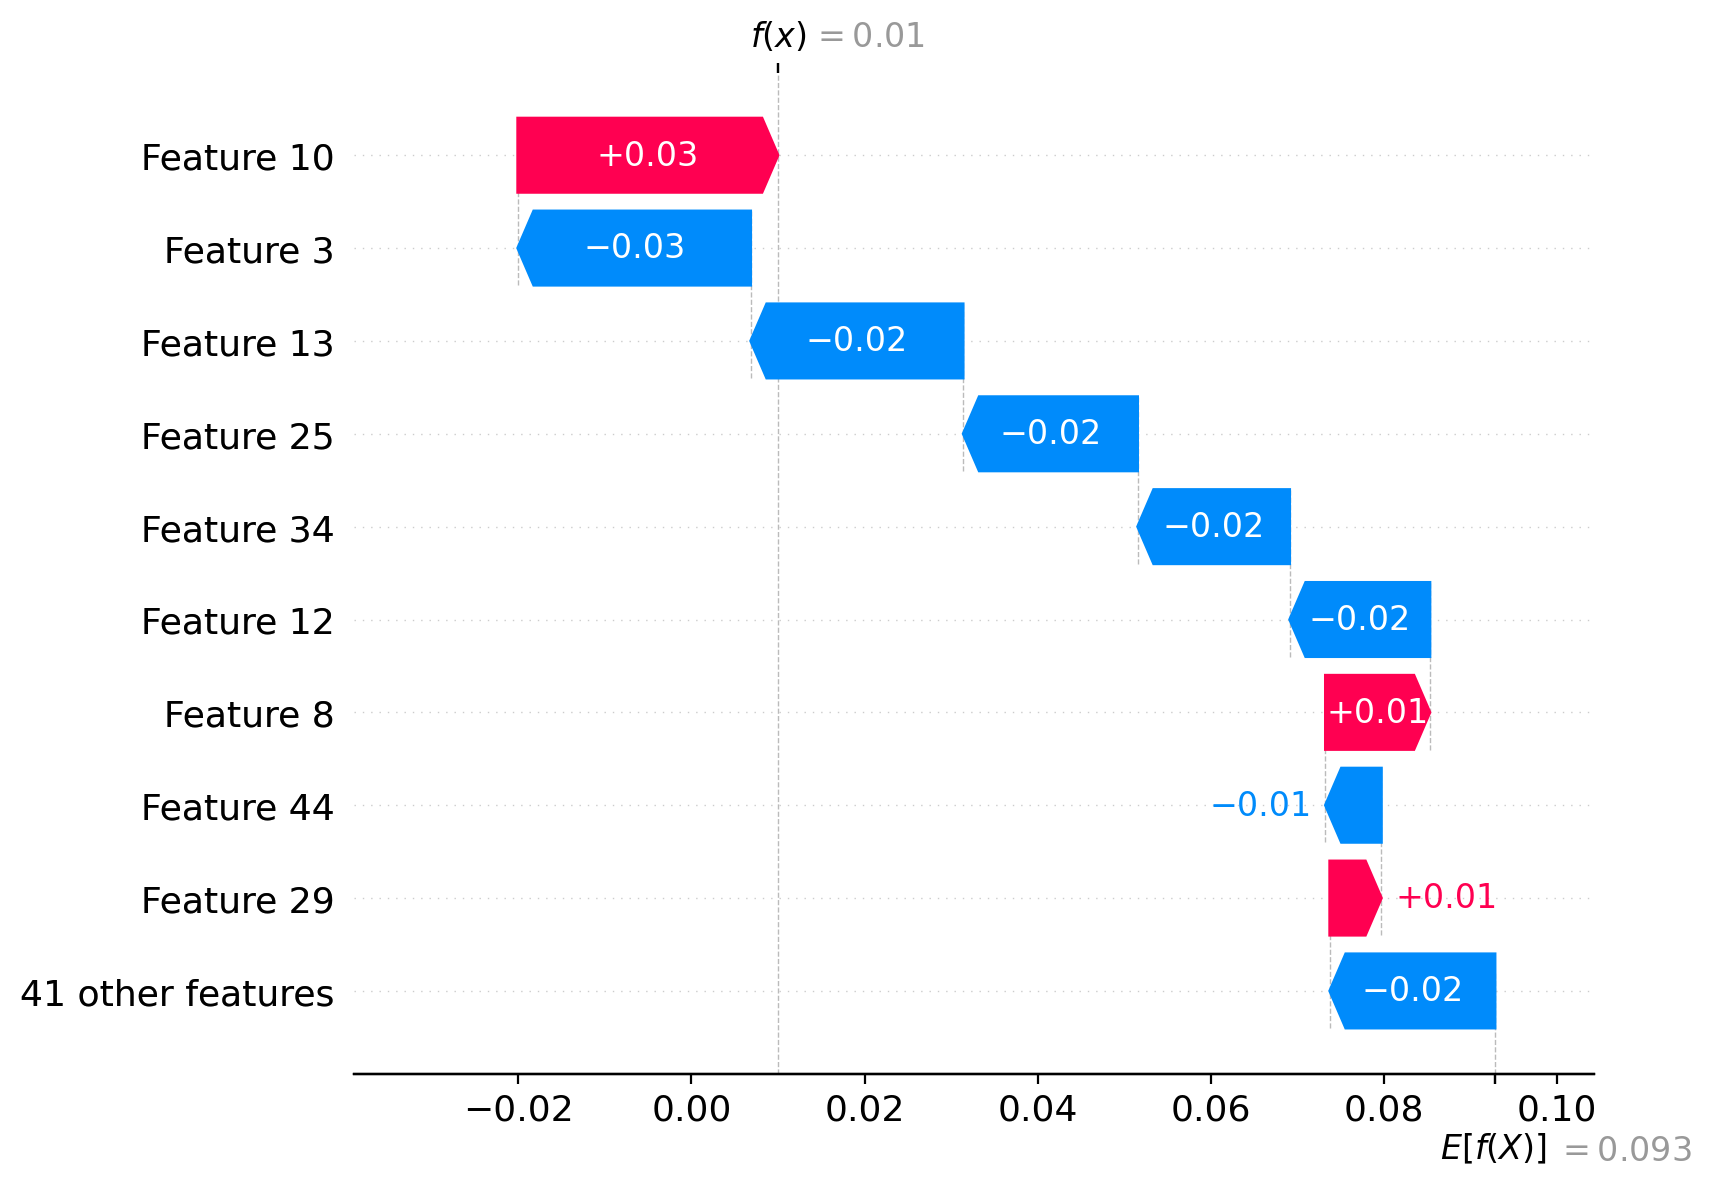
我们应该能够解释一个数据点:
idx = 99  # datapoint to prove
pred = model.predict_proba(X_test[[idx]])[:, cls]
predarray([0.01])我们可以证明我们在视觉上做得对:
waterfall_plot(Explanation(sv_cls[idx], explainer.expected_value[cls]))
在数学上:
np.allclose(pred, explainer.expected_value[cls] + sv[cls][idx].sum())True页面原文内容由Stack Overflow提供。腾讯云小微IT领域专用引擎提供翻译支持
原文链接:
https://stackoverflow.com/questions/73655285
复制相关文章
相似问题
腾讯云开发者

Copyright © 2013 - 2026 Tencent Cloud. All Rights Reserved. 腾讯云 版权所有
深圳市腾讯计算机系统有限公司 ICP备案/许可证号:粤B2-20090059 ![]() 粤公网安备44030502008569号
粤公网安备44030502008569号
腾讯云计算(北京)有限责任公司 京ICP证150476号 | 京ICP备11018762号