
如何处理CSV和多行标签?
假设我有以下数据。这是从LibreOffice导出的CSV,所以我假设这是正确的CSV格式。当我再次将这个CSV导入LibreOffice时,我将正确地看到单元格中的多行文本。
数据: MultilineLabels.csv
1,Simple,1.3
2,Single line,2.3
3,"Multiline
label",3.3
4,Simple again,4.3
5,Multiline\nlabel,5.3
6,Simple again,6.3
但是,现在,如果我想用下面的gnuplot脚本来绘制这个脚本:
脚本:
### How to handle CSV and multi-line labels in gnuplot?
reset session

FILE = "MultilineLabels.csv"
set datafile separator comma

set format x "\n"

plot FILE u 1:3:xtic(2) w lp pt 7 lc "red"
### end of script
我得到以下输出:
结果:
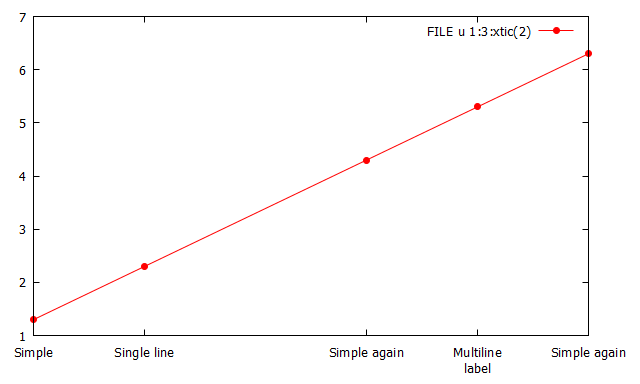
因此,x=3上的点和标签,即CSV的第3行和第4行是而不是,原因很明显: gnuplot只是将其解释为文本文件,并且没有特殊的CSV输入过滤器。
原则上,我可以使用一些外部工具(甚至是gnuplot本身)来替换\n匹配的双引号中的所有换行符。
这是唯一的解决办法,还是有更好的解决办法?
Stack Overflow用户
发布于 2022-09-13 14:36:41
解析CSV-文件肯定会比下面这个简单的例子更加复杂。Linux用户可能有一些这样的工具。
我更喜欢纯gnuplot的解决方案(因此与平台无关),尽管它们可能无法在速度和效率方面与专门的外部工具竞争。
这里有一个非常“简单”但不是非常健壮的gnuplot解决方案,如果第一行包含奇数双引号(绝对有改进的空间!),只需添加两行就可以了。要使其工作,您需要在数据库中加载数据1:1,而且,由于您是索引数据库,所以需要gnuplot>=5.2.0。
数据: SO73704046.csv
1,Simple,1.3
2,Single line,2.3
3,"Multiline
label",3.3
4,Simple again,4.3
5,Multiline\nlabel,5.3
6,Simple again,6.3脚本:(需要gnuplot>=5.2.0)
### How to handle CSV and multi-line labels in gnuplot?
reset session
FILE = 'SO73704046.csv'
FileToDatablock(f,d) = GPVAL_SYSNAME[1:7] eq "Windows" ? \
sprintf('< echo %s ^<^<EOD & type "%s"',d,f) : \
sprintf('< echo "\%s <<EOD" & cat "%s"',d,f) # Linux/MacOS
load FileToDatablock(FILE,'$DataCSV')
oddDQ(s) = int(sum[j=1:strlen(s)] (s[j:j] eq '"'))%2 # returns 1 if string contains odd number of double quotes, otherwise 0
set print $Data
c = 1
while c<=|$DataCSV| {
if (oddDQ($DataCSV[c])) {
s = $DataCSV[c]
print s[1:strlen(s)-1].'\n'.$DataCSV[c+1]
c=c+2
}
else {
print $DataCSV[c]
c=c+1
}
}
set print
set datafile separator comma
set format x "\n"
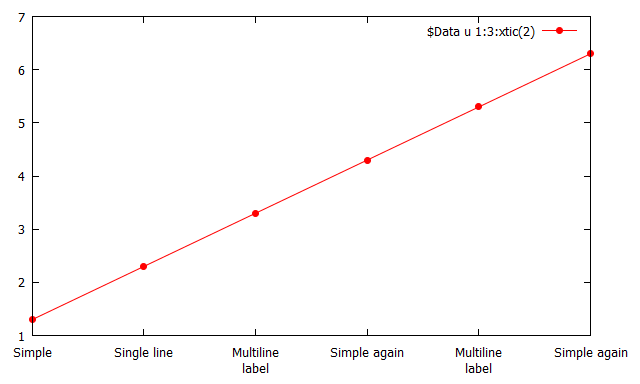
plot $Data u 1:3:xtic(2) w lp pt 7 lc "red"
### end of script结果:
数据库$Data
1,Simple,1.3
2,Single line,2.3
3,"Multiline\nlabel",3.3
4,Simple again,4.3
5,Multiline\nlabel,5.3
6,Simple again,6.3
https://stackoverflow.com/questions/73704046
复制相似问题
腾讯云开发者

Copyright © 2013 - 2026 Tencent Cloud. All Rights Reserved. 腾讯云 版权所有
深圳市腾讯计算机系统有限公司 ICP备案/许可证号:粤B2-20090059 ![]() 粤公网安备44030502008569号
粤公网安备44030502008569号
腾讯云计算(北京)有限责任公司 京ICP证150476号 | 京ICP备11018762号