
如何生成由多个子情节生成的matplotlib动画?
如何生成由多个子情节生成的matplotlib动画?
提问于 2022-09-16 18:08:31
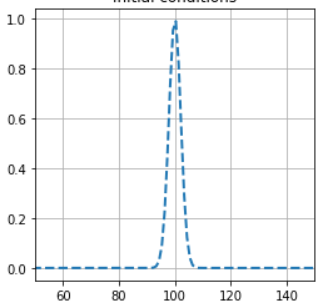
我有代码可以生成一个传播的高压线图。每个地块plt.plot(r, Sevol[0])生成一个类型的图像:
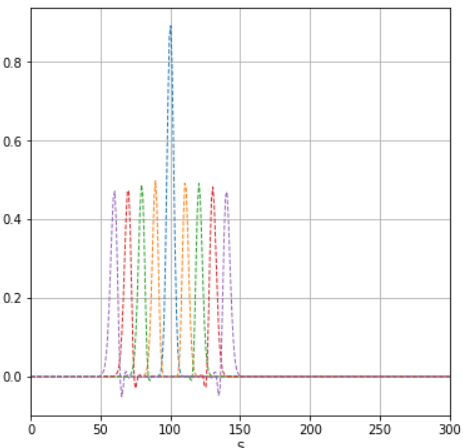
图中的许多子图概括了上面的图像:
plt.plot(r, Sevol[0])
plt.plot(r, Sevol[10])
plt.plot(r, Sevol[20])
plt.plot(r, Sevol[30])
plt.plot(r, Sevol[40])
我想要制作一个动画,在这个动画中,我可以一次绘制一个plt.plot(r, Sevol[i])生成的每个图像,这样前一个图像就会被下一个图像叠加。
fig = plt.figure()

plt.xlabel('r')
plt.xlabel('S')
plt.grid()
#plt.plot(r, Sevol[0])
#plt.plot(r, Sevol[2])
#plt.plot(r, Sevol[3])
#plt.plot(r, Sevol[4], color='C1', linestyle='--', linewidth=1)
#plt.plot(r, Sevol[5], color='C0', linestyle='--', linewidth=1)
#plt.plot(r, Sevol[6], color='C1', linestyle='--', linewidth=1)
plt.xlim(ri, rf)

graph, = plt.plot([], [], color='gold', markersize=3)

def animate(i):
  graph.set_data(r[:i], Sevol[:i])
  return graph,

skipframes = int(len(r)/200)
if skipframes == 0:
    skipframes = 1

ani = FuncAnimation(fig, animate, frames=range(0,len(r),skipframes), interval=10, blit = True, repeat = False)

aniStack Overflow用户
发布于 2022-09-16 21:03:47
与使用animate(i)函数返回每个帧的图形不同,您只需为要显示的每一行调用plt.plot()即可。
删除skipframes变量/循环还可以使它更清楚地知道FuncAnimation中的frames值应该是什么。
注意:这不是最有效的方法,但只要你画出的样本相对较少,动画中就不会有任何滞后问题。
#################### DELETE THIS #######################
graph, = plt.plot([], [], color='gold', markersize=3)

def animate(i):
    graph.set_data(r[:i], yLst[:i])
    return graph,

skipframes = int(len(r)/200)
if skipframes == 0:
    skipframes = 1

ani = FuncAnimation(fig, animate, frames=range(0,len(r),skipframes), interval=10, blit = True, repeat = False)

#################### INSERT THIS #######################
def animate(i):
    numPlots = i //10    # how many plots (-1) will be shown based on the frame.
    for n in range(numPlots):
        plt.plot(r[n], Sevol[n], color='gold', markersize=3)

ani = FuncAnimation(fig, animate, frames=100, interval=10, blit = True, repeat = False)页面原文内容由Stack Overflow提供。腾讯云小微IT领域专用引擎提供翻译支持
原文链接:
https://stackoverflow.com/questions/73748773
复制相关文章
相似问题
腾讯云开发者
