
从计数表生成venn图
从计数表生成venn图
提问于 2022-10-11 12:26:56
我试图创建一个venn图,以帮助我检查参与者组之间有多少共享变量(物种)。我有一个尺寸97 (参与者)x 320的数据。我的前2列分别是participant_id和participant_group,其余的318列是物种的名称及其各自的计数。我想要创建一个venn图,它将告诉我有多少物种是在所有组之间共享的。这里是一个可重复的例子。
participant_id <- c("P01","P02","P03","P04","P05","P06","P07","P08","P09","P10", "P11", "P12", "P13", "P14", "P15")
participant_group <- c("control", "responsive", "resistant", "non-responsive", "control", "responsive", "resistant", "non-responsive", "resistant", "non-responsive", "control", "responsive", "non-responsive", "control", "resistant")
A <- c (0, 54, 23, 4, 0, 2, 0, 35, 0, 0, 45, 0, 1, 99, 12)
B <- c (10, 0, 1, 0, 4, 65, 0, 1, 52, 0, 0, 15, 20, 0, 0)
C <- c (0, 0, 0, 5, 35, 0, 0, 45, 0, 0 , 0, 22, 0, 89, 50)
D <- c (0, 0, 45, 0, 1, 0, 0, 0, 56, 32, 0, 0, 40, 0, 0)
E <- c (0, 0, 40, 5, 0, 0, 0, 45, 0, 1, 76, 0, 34, 56, 31)
F <- c (0, 64, 1, 5, 0, 0, 80, 0, 0, 1, 76, 0, 34, 0, 32)
G <- c (12, 5, 0, 0, 80, 45, 0, 0, 76, 0, 0, 0, 0, 32, 11)
H <- c (0, 0, 0, 5, 0, 0, 80, 0, 0, 1, 0, 0, 34, 0, 2)
example_df <- data.frame(participant_id, participant_group, A, B, C, D, E, F, G, H)
我可以看到所有精彩的venn图表包,但我正在努力正确地格式化我的数据。我从以下几个方面开始:
example_df %>%
group_by(participant_group) %>%
dplyr::summarise(across(where(is.numeric), sum)) %>%
mutate_if(is.numeric, ~1 * (. > 0))因此,现在我有一个指示,一个物种(A,B,C,等)是否存在(1)或没有(0)在每个群体中。现在,我想通过维恩图(类似于这个https://statisticsglobe.com/venn-diagram-with-proportional-size-in-r )来看到物种之间的重叠。然而,我有点困在下一步该做什么上了。有人有什么想法吗?我希望这是合理的!耽误您时间,实在对不起。
当使用@的代码时,我得到了这个图表。
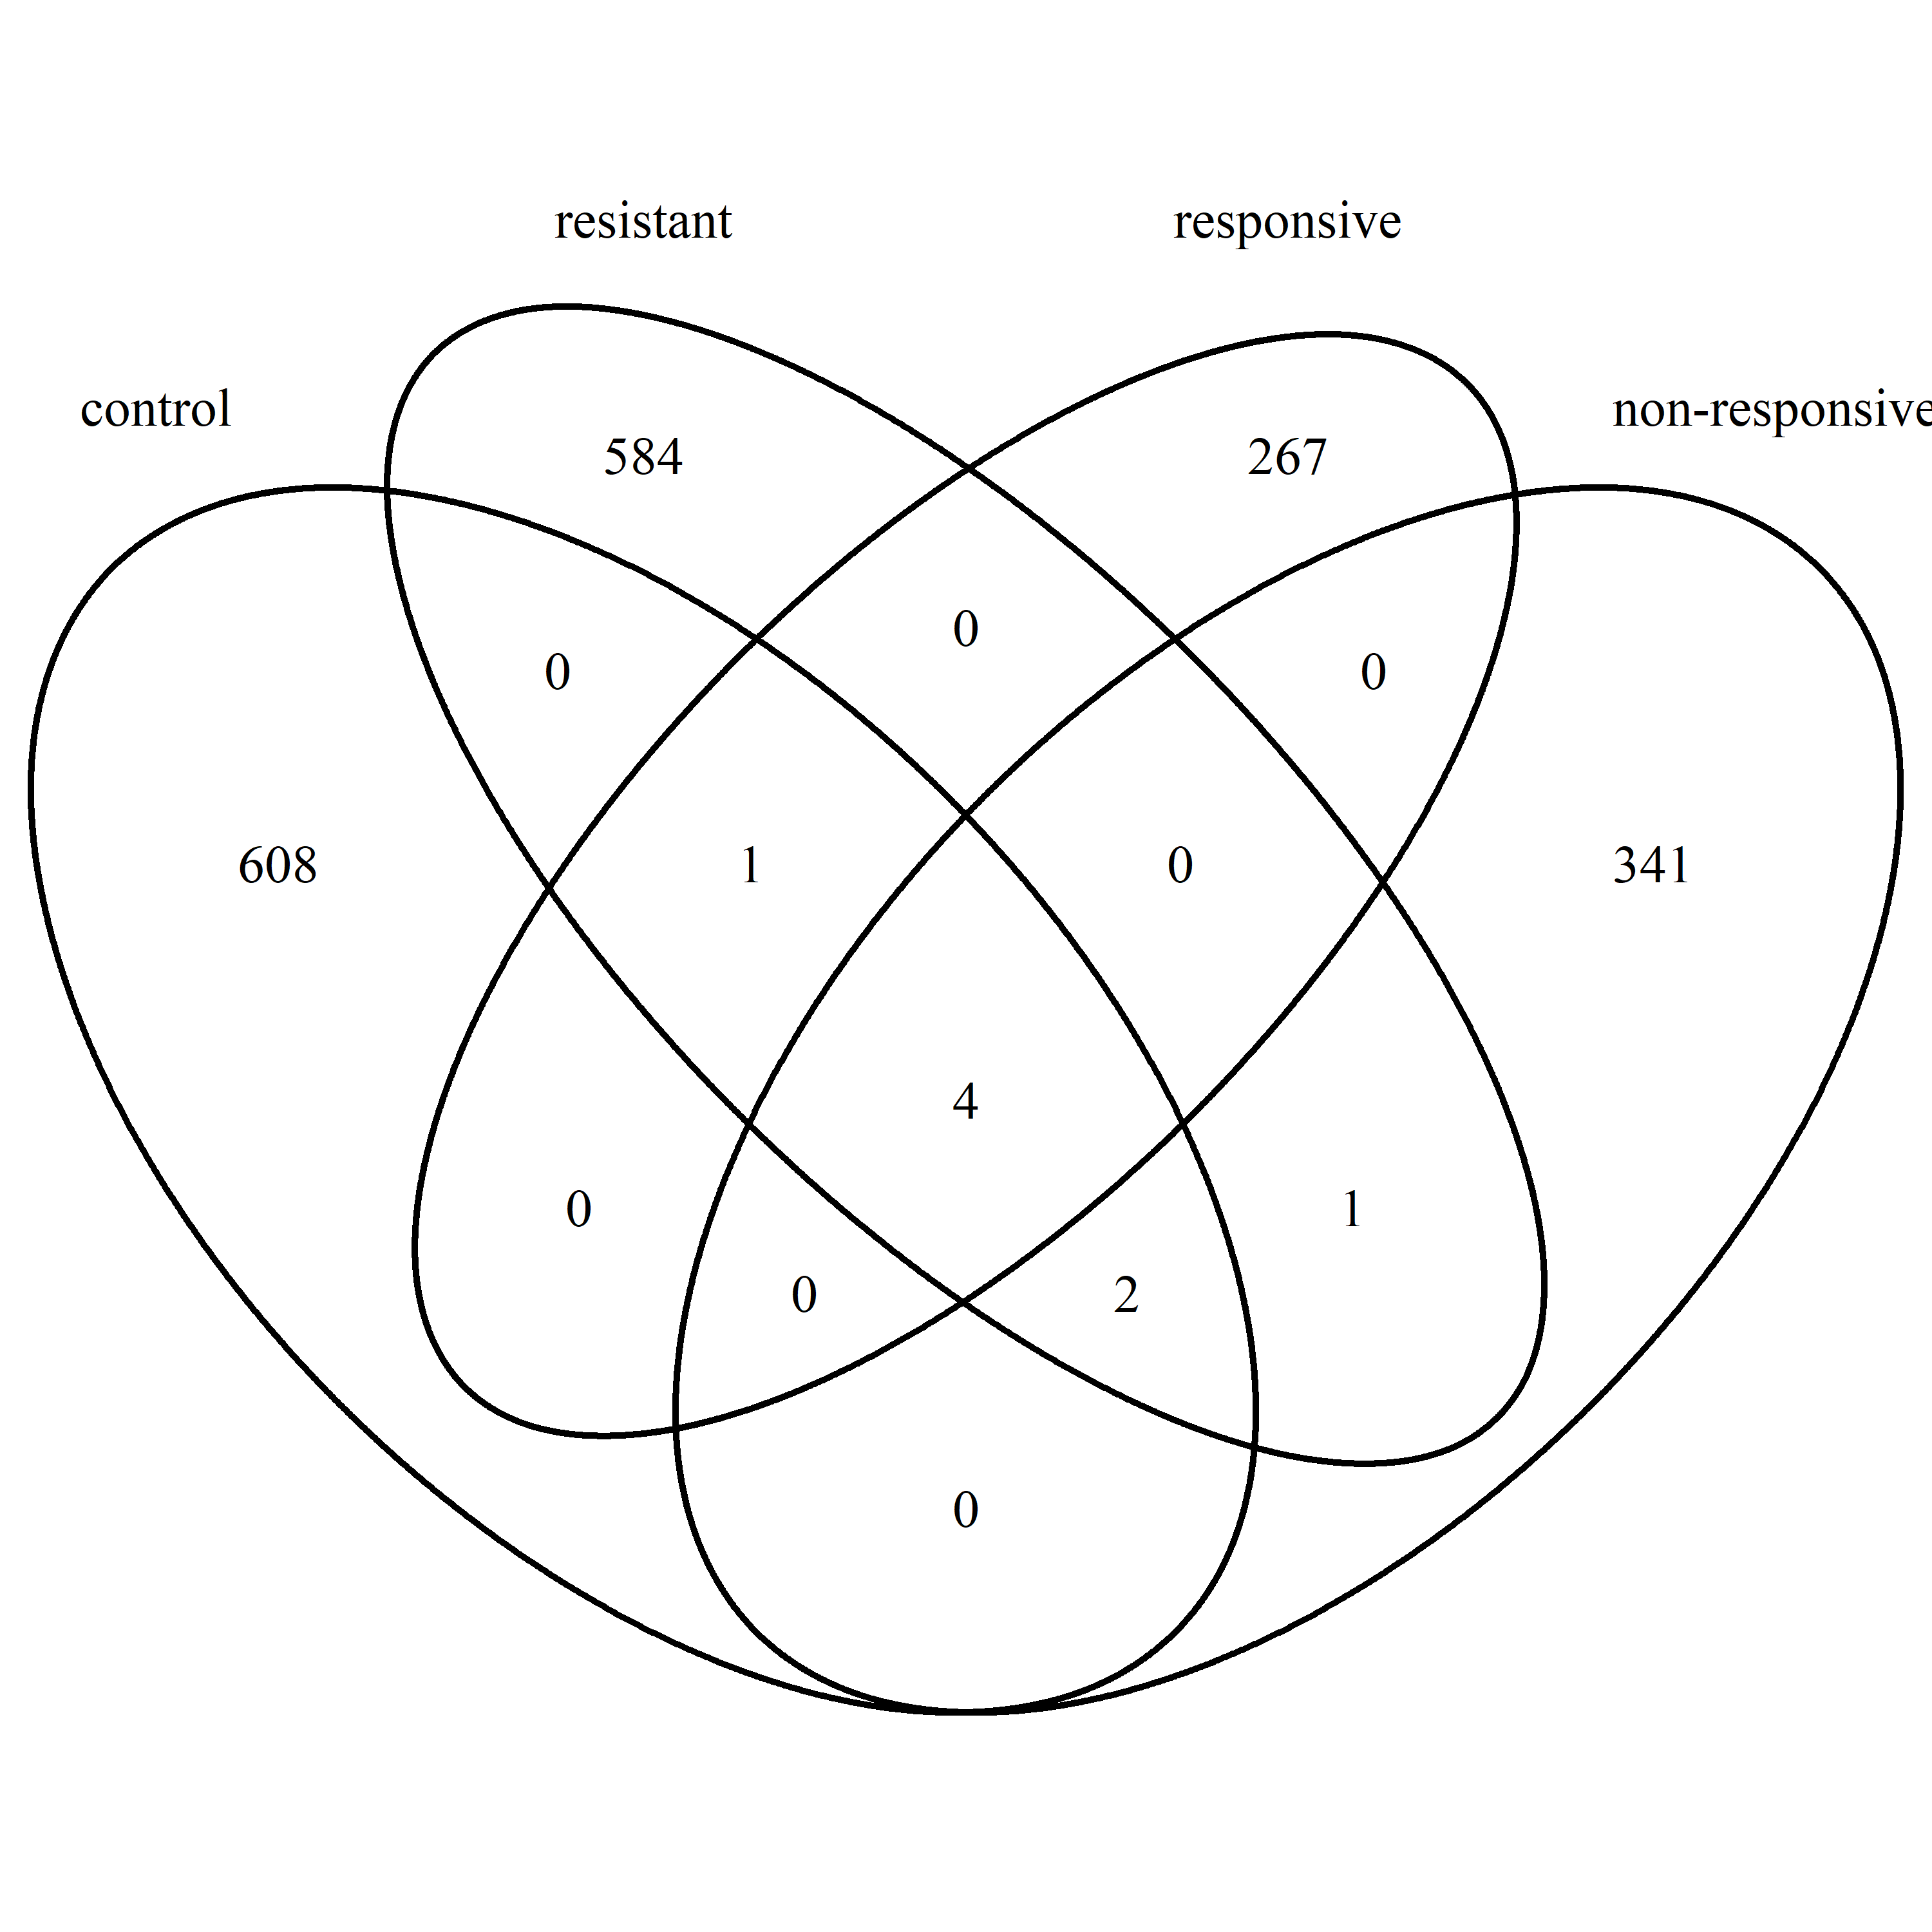
但这里的目标是有一些东西,显示出物种的共同存在/缺席(A,B,C等)之间的团体,而不管数量。
回答 1
Stack Overflow用户
发布于 2022-10-11 13:28:15
使用
library(VennDiagram)
library(dplyr)
library(magrittr)
我管理了以下起点:
 groupSums <- example_df %>%
      group_by(participant_group) %>%
      summarise(across(where(is.numeric), sum))

 forVenn <- lapply(groupSums$participant_group, function(x) {
      rep(names(groupSums)[-1], times = groupSums[groupSums$participant_group == x,-1])
    })

 names(forVenn) <- groupSums$participant_group

venn.diagram(forVenn, filename = "Venn.png", force.unique = FALSE)页面原文内容由Stack Overflow提供。腾讯云小微IT领域专用引擎提供翻译支持
原文链接:
https://stackoverflow.com/questions/74028157
复制相关文章
相似问题
腾讯云开发者
