
ggplot2和ggstar中两个图形层与geom_point和geom_star的合并图例
ggplot2和ggstar中两个图形层与geom_point和geom_star的合并图例
提问于 2022-10-11 16:30:29
我花了一整天的时间试图解决这个愚蠢的图形问题,但没有成功.
我有一个pcoa数据集,有10个人口,比如“特殊”(我想将它们显示为实心符号)和4个“非特殊”(4个非固态符号)。
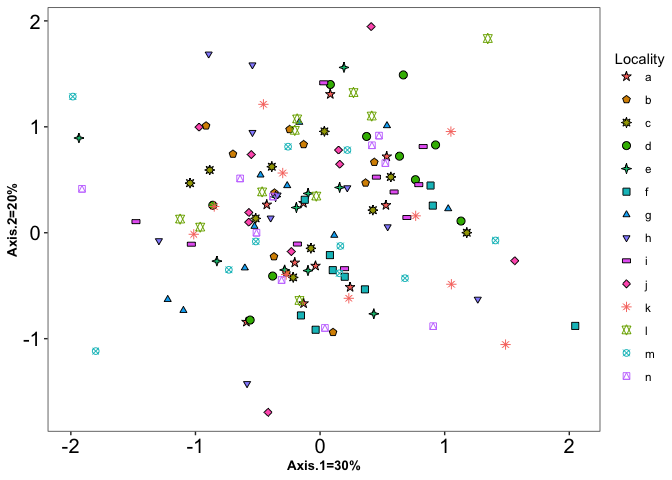
我想要一个传说,每一个符号与一个物种有关,每种颜色都与“特殊”和“非特殊”的种群有关。
一个例子
df <- data.frame(Species=sort(rep(letters[1:10], 14)), Locality=sort(rep(LETTERS[1:10], 14)), Axis.1=rnorm(140,0,0.7), Axis.2=rnorm(140,0,0.7))

#NOTE:in the original dataset, 2 population may share the same species, thus the same symbol

special<- ("A","B","C","D",E","F","G","H","I","J") #this must be solid symbol
non_special<-("K","M","N","O") # this must be empty symbols

df.special<–subset(df, Species== special)
df.non.special<–subset(df, Species == non_special)

library(ggplot)
library(ggstar)


#solid symbols for special population
ggplot(data= df.special, aes(x=Axis.1,y=Axis.2, fill= Locality)) +
      geom_star(aes(starshape=Species), size=2)+
scale_starshape_manual(values=c(1,5,9,15,14,13,11,23,21,28))+

#empty symbols for non special population
geom_point(data= df.non.special, aes(x = Axis.1,  y = Axis.2, shape=Species, color=Locality), size=2)+
scale_shape_manual(name = "Legend", values=c(8,11,13,14))+

#additional style
theme_bw()+ xlab("Axis.1=30%") +
 ylab("Axis.2=20%")+
theme(panel.grid = element_blank(),
legend.title = element_text(hjust = 0.5), axis.text = element_text(size = 15, colour = "black"),
 axis.title = element_text(size = 10, face = "bold"))
期望的输出应该是一个散点图,其中有一个图例,为特殊的和非特殊的种群分别有实心和空的符号,分别作为不同的物种着色。
因此,我需要以某种方式实现scale_fill_manual和scale_shape_manual (需要空符号),并将scale_fill_manual添加到scale_starshape_manual中。
提前谢谢你
Stack Overflow用户
发布于 2022-10-11 17:44:42
要达到你想要的结果,一个选择就是
- 使用
guide_legend的override.aes参数为color/fill传说设置shapes/starshapes。 - 去掉
shape和starshape图例H 212H 113去除颜色图例的图例标题,在我的情况下是spacing和D17的传奇,使它们成为一个。H 218G 219
注意:我稍微调整了你的示例数据和代码,因为它不工作,例如不包括任何非特殊字符。见下文。
library(ggplot2)
library(ggstar)

ggplot(data = df.special, aes(x = Axis.1, y = Axis.2)) +
  geom_star(aes(starshape = Species, fill = Locality), size = 2) +
  scale_starshape_manual(values = c(1, 5, 9, 15, 14, 13, 11, 23, 21, 28)) +
  geom_point(data = df.non.special, aes(shape = Species, color = Locality), size = 2) +
  scale_shape_manual(values = c(8, 11, 13, 14)) +
  theme_bw() +
  xlab("Axis.1=30%") +
  ylab("Axis.2=20%") +
  theme(
    panel.grid = element_blank(),
    legend.title = element_text(hjust = 0.5), axis.text = element_text(size = 15, colour = "black"),
    axis.title = element_text(size = 10, face = "bold")
  ) +
  guides(
    color = guide_legend(
      override.aes = list(shape = c(8, 11, 13, 14)),
      order = 2
    ),
    shape = "none",
    fill = guide_legend(
      override.aes = list(starshape = c(1, 5, 9, 15, 14, 13, 11, 23, 21, 28)),
      order = 1
    ),
    starshape = "none"
  ) +
  labs(color = NULL) +
  theme(legend.spacing.y = unit(0, "pt"), legend.margin = margin())
数据
df <- data.frame(
  Species = sort(rep(LETTERS[1:14], 10)),
  Locality = sort(rep(letters[1:14], 10)),
  Axis.1 = rnorm(140, 0, 0.7),
  Axis.2 = rnorm(140, 0, 0.7)
)

special <- c("A", "B", "C", "D", "E", "F", "G", "H", "I", "J")
non_special <- c("K", "L", "M", "N")

df.special <- subset(df, Species %in% special)
df.non.special <- subset(df, Species %in% non_special)页面原文内容由Stack Overflow提供。腾讯云小微IT领域专用引擎提供翻译支持
原文链接:
https://stackoverflow.com/questions/74031326
复制相关文章
相似问题
腾讯云开发者
