
使用python在shapefile中创建点网格
使用python在shapefile中创建点网格
提问于 2022-10-13 11:27:57
我正在使用geopandas和gdal在python中编写一个shapefile文件。我期待创建网格(与规则的1000米间隔点)内的多边形形状文件。我已经重新投影了文件以便单位可以是米。然而,我找不到任何直接的方法来实现这一点。在这方面,任何一个指南都可以吗?
我正在分享代码,到目前为止我已经尝试过:
from osgeo import gdal, ogr
import numpy as np
import matplotlib.pyplot as plt
import os
import sys
import pandas as pd
import geopandas as gpd
from shapely.geometry import Polygon
source_ds = ogr.Open(r"E:\review paper\sample tb data for recon\descend\tiffbt\alaska_bound.shp")
boundFile =gpd.read_file(r"E:\review paper\sample tb data for recon\descend\tiffbt\alaska_bound.shp")
bound_project = boundFile.to_crs({'init': 'EPSG:3572'})
print(bound_project.crs)
print(bound_project.total_bounds)
坐标系和包围盒坐标如下(上述代码的输出):
+init=epsg:3572 +type=crs
[-2477342.73003557 -3852592.48050272 1305143.81797914 -2054961.64359753]回答 1
Stack Overflow用户
回答已采纳
发布于 2022-10-18 10:07:47
现在还不清楚你是要创建一个方框网格还是一个点网格。若要更改为点,请使用:
# create a grid for geometry
gdf_grid = gpd.GeoDataFrame(
    geometry=[
        shapely.geometry.Point(x, y)
        for x in np.arange(a, c, STEP)
        for y in np.arange(b, d, STEP)
    ],
    crs=crs,
).to_crs(gdf.crs)- 已经用了50公里,而不是1000米用于演示,
- 和阿拉斯加,它对于多边形,有必要考虑反子午线。没有这个,你将有超过350度的多边形,当重新投影到EPSG:4326
- approach是简单的,,
- ,获得阿拉斯加的几何形状文件
- 项目,以米为单位。使用了UTM
- 获取了使用
- 的几何对象的网格,将几何网格限制在与geometry
相交的网格上。
你将在这样的纬度观察到,如预期的那样,projections)和EPSG:4326之间会发生扭曲(projections)的性质)。
全码
import geopandas as gpd
import numpy as np
import shapely.geometry
gdf = gpd.read_file("https://www2.census.gov/geo/tiger/TIGER2018/ANRC/tl_2018_02_anrc.zip")
STEP = 50000
crs = gdf.estimate_utm_crs()
# crs = "EPSG:3338"
a, b, c, d = gdf.to_crs(crs).total_bounds
# create a grid for geometry
gdf_grid = gpd.GeoDataFrame(
geometry=[
shapely.geometry.box(minx, miny, maxx, maxy)
for minx, maxx in zip(np.arange(a, c, STEP), np.arange(a, c, STEP)[1:])
for miny, maxy in zip(np.arange(b, d, STEP), np.arange(b, d, STEP)[1:])
],
crs=crs,
).to_crs(gdf.crs)
# exclude geometries that cross antimeridian
gdf_grid = gdf_grid.loc[~gdf_grid["geometry"].bounds.pipe(lambda d: d["maxx"] - d["minx"]).ge(350)]
# restrict grid to only squares that intersect with geometry
gdf_grid = (
gdf_grid.sjoin(gdf.dissolve().loc[:,["geometry"]])
.pipe(lambda d: d.groupby(d.index).first())
.set_crs(gdf.crs)
.drop(columns=["index_right"])
)
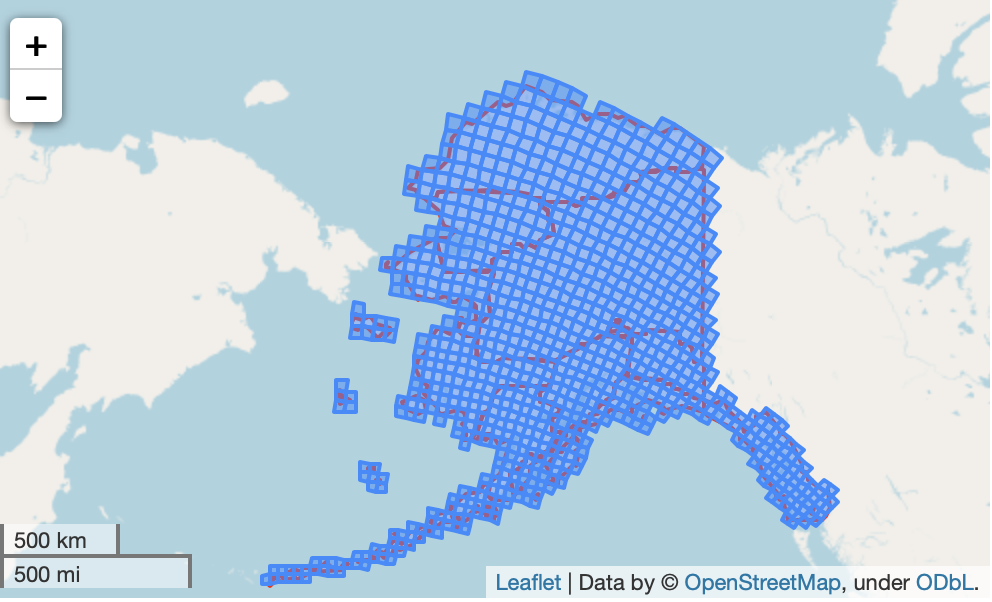
m = gdf.explore(color="red", style_kwds={"fillOpacity":0})
gdf_grid.explore(m=m)输出
页面原文内容由Stack Overflow提供。腾讯云小微IT领域专用引擎提供翻译支持
原文链接:
https://stackoverflow.com/questions/74054997
复制相关文章
相似问题
腾讯云开发者
