
世界合唱图
世界合唱图
提问于 2022-10-13 19:24:19
你能帮我画出几个国家的计数值(来自国家向量)吗?其他国家应该是灰色还是白色。
事先非常感谢!
library(ggplot2)
library(see)
library(maps)

# vector of countries
countries <- c("Mexico", "USA", "Germany", "France",
               "Spain", "China", "India", "Australia")

# vector of counts ---
count_response <- c(80, 200, 180, 175, 140, 250, 230, 240)

worldMap <- map_data("world")
ggplot(data = worldMap,
       aes(x = long,
           y = lat,
           group = group)) +
  geom_polygon(colour = "black",
               fill = "gold") +
  labs(x = "Longitude",
       y = "Latitude") +
theme_lucid()回答 1
Stack Overflow用户
发布于 2022-10-13 21:21:11
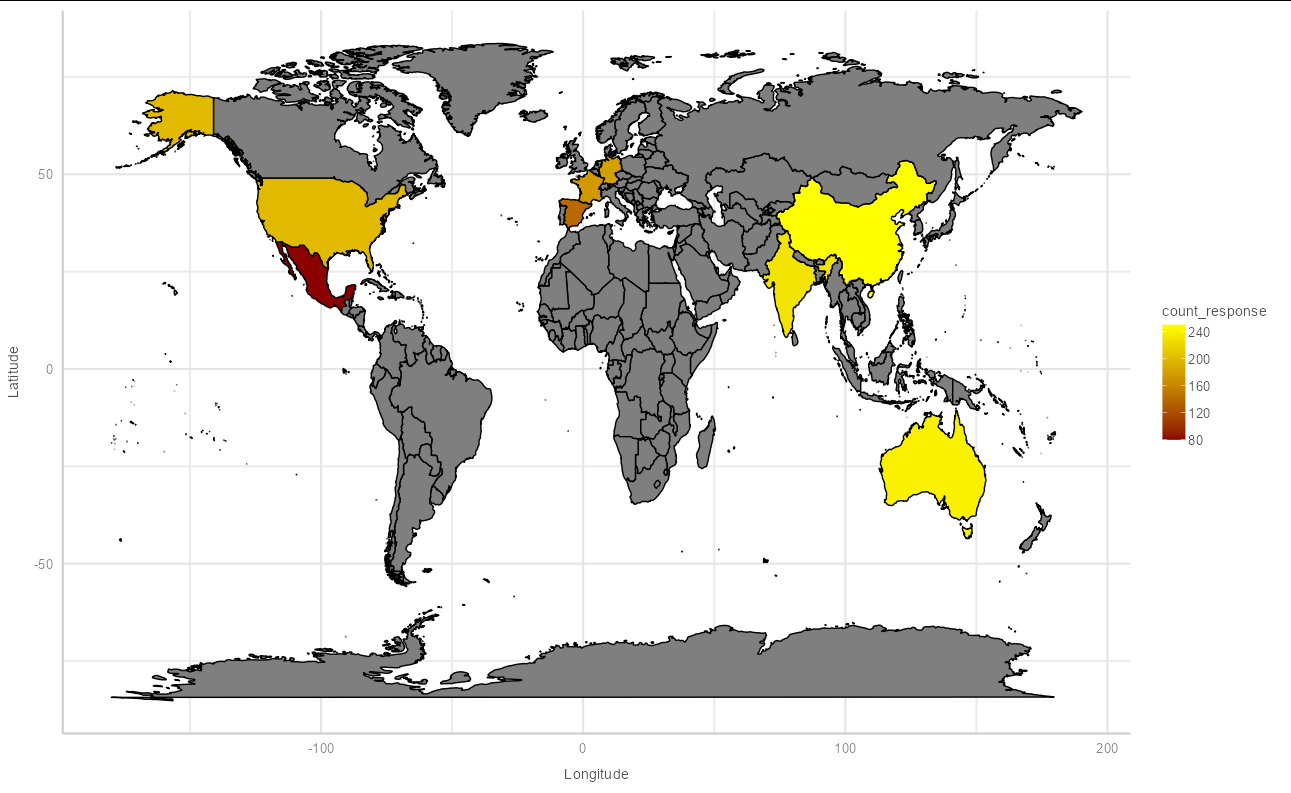
您需要将数据加入到世界地图数据框架中。,这将允许您将填充颜色映射到count_response。
worldMap <- map_data("world")

df <- data.frame(countries, count_response)

ggplot(data = dplyr::left_join(worldMap, df, by = c(region = "countries")),
       aes(x = long,
           y = lat,
           group = group,
           fill = count_response)) +
  geom_polygon(color = "black") +
  labs(x = "Longitude",
       y = "Latitude") +
  theme_lucid(base_size = 16) +
  scale_fill_gradient(low = "red4", high = "yellow")
页面原文内容由Stack Overflow提供。腾讯云小微IT领域专用引擎提供翻译支持
原文链接:
https://stackoverflow.com/questions/74060833
复制相关文章
相似问题
腾讯云开发者
