
是否有一个python函数允许我添加一个额外的层来跨越选项卡?
是否有一个python函数允许我添加一个额外的层来跨越选项卡?
提问于 2022-11-17 00:01:24
我正在尝试创建一个表,它将模仿excel的下表。
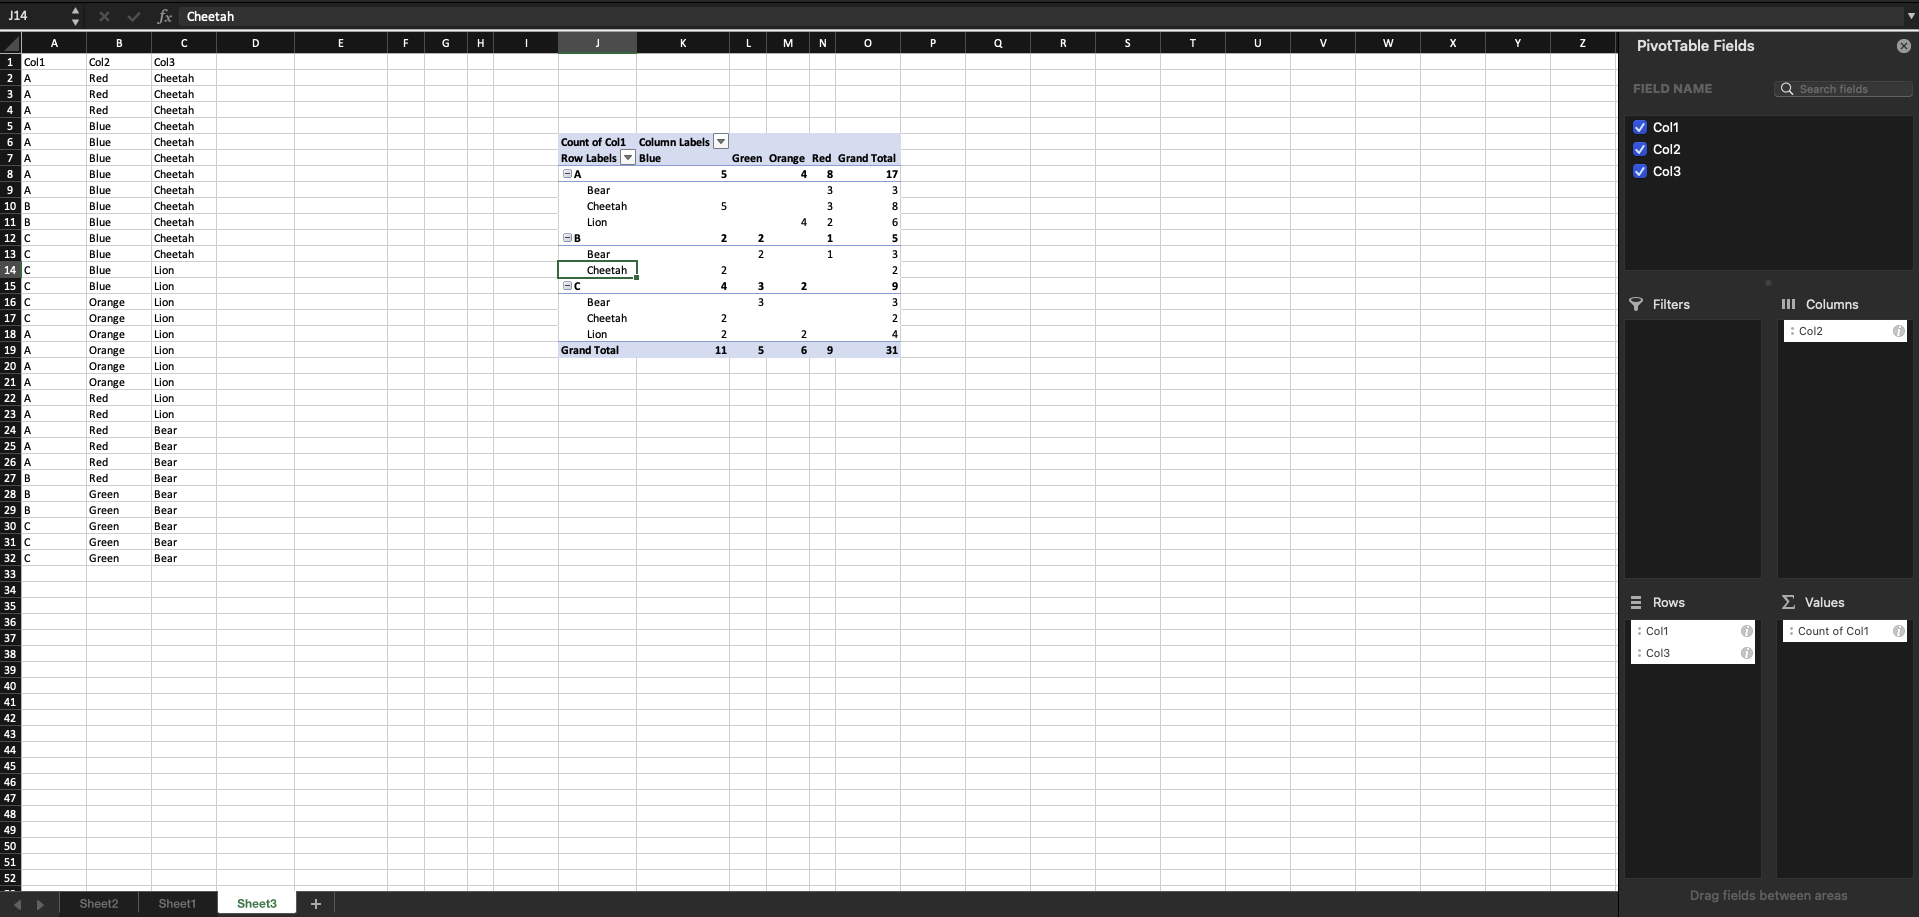
我的数据是: Col1 Col2 Col3 A红豹A蓝猎豹B蓝猎豹B蓝猎豹C蓝狮C橙狮C橙狮子C红熊B红熊B绿熊B绿熊C绿熊
我尝试基于col3将数据帧分割成更小的数据帧,但我希望它仍然是一个表,如上图所示
回答 2
Stack Overflow用户
回答已采纳
发布于 2022-11-17 03:16:25
使用交叉表
df = pd.crosstab(
    index=[df.Col1, df.Col3],
    columns=df.Col2,
    rownames=["Row Labels", "Column Labels"],
    colnames=["Count of Col1"],
    margins=True,
    margins_name="Grand Total"
)

print(df)
OutPut:
Count of Col1              Blue  Green  Orange  Red  Grand Total
Row Labels  Column Labels
A           Bear              0      0       0    3            3
            Cheetah           5      0       0    3            8
            Lion              0      0       4    2            6
B           Bear              0      2       0    1            3
            Cheetah           2      0       0    0            2
C           Bear              0      3       0    0            3
            Cheetah           2      0       0    0            2
            Lion              2      0       2    0            4
Grand Total 11 5 6 9 31页面原文内容由Stack Overflow提供。腾讯云小微IT领域专用引擎提供翻译支持
原文链接:
https://stackoverflow.com/questions/74468667
复制相关文章
相似问题
腾讯云开发者
