
如何将地球特征和陆地/海洋掩模应用于Cartopy的高分辨率海岸线?
我在使用Cartopy中GSHHS数据集的海岸线。这对海岸线有很高的分辨率。但我不仅要绘制高分辨率的海岸线,而且要为海洋涂上一个面具。
import matplotlib.pyplot as plt
import cartopy

fig = plt.figure(figsize=(20,12))
ax = plt.axes(projection=cartopy.crs.PlateCarree())
coast = cartopy.feature.GSHHSFeature(scale="full")
ax.add_feature(coast, linewidth=2)
ax.add_feature(cartopy.feature.NaturalEarthFeature("physical", "land", "10m"))
ax.set_extent([-17, -16, 27.9, 28.7])执行代码时,图像有差异,因为我猜ax.add_feature(cartopy.feature.NaturalEarthFeature("physical", "land", "10m"))使用的是"10m“分辨率,而GSHHS具有更高的分辨率。
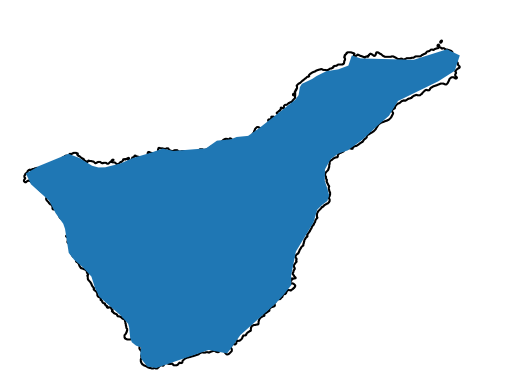
如何使用更高分辨率的GSHHS掩蔽?谢谢。
Stack Overflow用户
发布于 2022-11-23 01:07:34
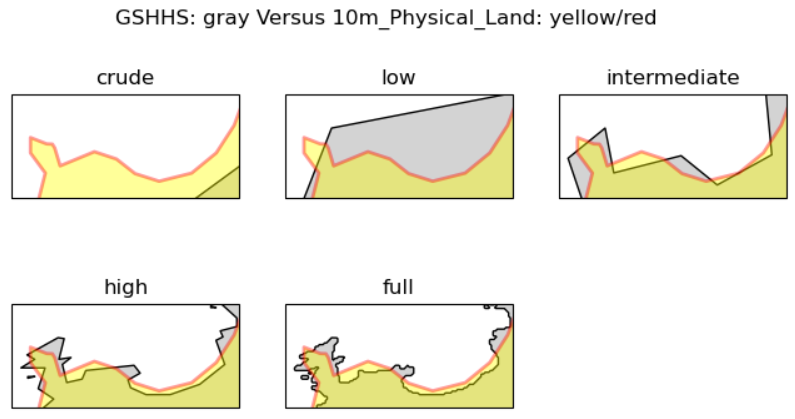
在回答how to apply a mask to hide features in the main plot问题之前,我们需要先调查一下可用的掩码。
在我们的例子中,main plot是Natural_Earth 10m解析物理域特性,GSHHSFeature的各种分辨率作为可用的掩码。
下面的代码和输出图显示了这种洞察力。
# Code adapted from:-
# Src: https://ctroupin.github.io/posts/2019-09-02-fine-coast/
import matplotlib.pyplot as plt
import cartopy
import cartopy.crs as ccrs
import cartopy.feature as cfeature

resolutions = {"c": "crude",
               "l": "low",
               "i": "intermediate",
               "h": "high",
               "f": "full"}
coordinates = (8.7, 8.81, 42.55, 42.60)
myproj = ccrs.PlateCarree()
fig = plt.figure(figsize=(8, 4))
for i, res in enumerate(resolutions):
    ax = plt.subplot(2, 3, i+1, projection=myproj)
    coast = cfeature.GSHHSFeature(scale=res)
    ax.add_feature(coast, facecolor="lightgray")
    ax.add_feature(cartopy.feature.NaturalEarthFeature("physical", "land", "10m"),
              ec="red", fc="yellow", lw=2, alpha=0.4)
    ax.set_xlim(coordinates[0], coordinates[1])
    ax.set_ylim(coordinates[2], coordinates[3])
    plt.title(resolutions[res])
plt.suptitle("GSHHS: gray Versus 10m_Physical_Land: yellow/red")
plt.show()
假设我们需要一个在这个缩放级别的情节。很明显,来自两个数据源的轮廓并不适合观众的眼睛。我们可以得出结论,所有可用的掩码都不适合目标地块。
但是,如果地块范围较宽,或规模较小,再加上一些制图技术,例如使用较厚的海岸线,就可以得到可接受的地块。这个过程是试错的方法.
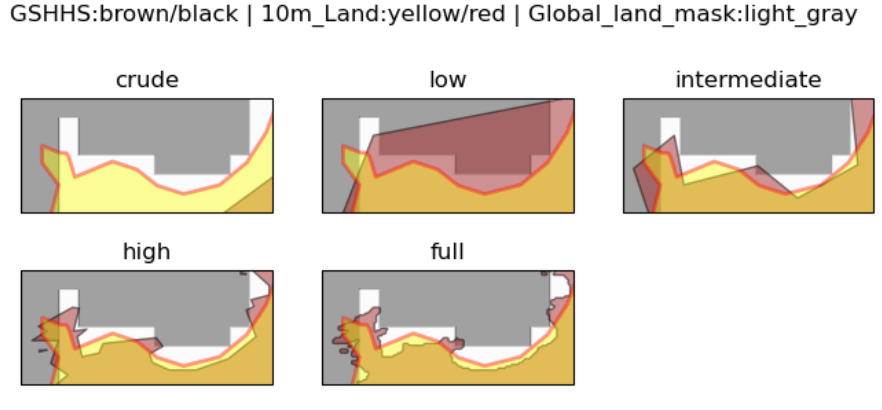
Edit1
添加(遮罩)后,可以绘制更多的选项以供比较。
from global_land_mask import globe
import matplotlib.pyplot as plt
import cartopy.crs as ccrs
import cartopy.feature as cfeature
import numpy as np

# Extent of map in degrees
minlon,maxlon,minlat,maxlat = (8.7, 8.81, 42.55, 42.60)

# Lat/lon points to get for `global_land_mask` uses
# Finer than 500x250 has no improvement
lons = np.linspace(minlon,maxlon, 500)
lats = np.linspace(minlat,maxlat, 250)

# Make a grid
lon_grid, lat_grid = np.meshgrid(lons,lats)

# Get whether the points are on land.
z = globe.is_land(lat_grid, lon_grid)

# GSHHS ...
resolutions = {"c": "crude",
               "l": "low",
               "i": "intermediate",
               "h": "high",
               "f": "full"}

myproj = ccrs.PlateCarree()
fig = plt.figure(figsize=(8, 4))
for i, res in enumerate(resolutions):
    ax = plt.subplot(2, 3, i+1, projection=myproj)

    # GSHHSFeature
    coast = cfeature.GSHHSFeature(scale=res)
    ax.add_feature(coast, facecolor="brown", alpha=0.5)

    # 10m physical_land
    ax.add_feature(cfeature.NaturalEarthFeature("physical", "land", "10m"),
              ec="red", fc="yellow", lw=2, alpha=0.4)

    # Global_land_mask data is used to create fillcontour
    # The fillcontour with proper (colormap, zorder, alpha) can be used as land `mask`
    ax.contourf(lon_grid, lat_grid, z, cmap="Greys_r", alpha=0.4)

    ax.set_xlim(minlon, maxlon)
    ax.set_ylim(minlat, maxlat)
    plt.title(resolutions[res])

plt.suptitle("GSHHS:brown/black | 10m_Land:yellow/red | Global_land_mask:light_gray")
plt.show()

# The best resolutuion from `Global_land_mask` is plotted in `lightgray` covering the sea areas
https://stackoverflow.com/questions/74533204
复制相似问题
腾讯云开发者

Copyright © 2013 - 2026 Tencent Cloud. All Rights Reserved. 腾讯云 版权所有
深圳市腾讯计算机系统有限公司 ICP备案/许可证号:粤B2-20090059 ![]() 粤公网安备44030502008569号
粤公网安备44030502008569号
腾讯云计算(北京)有限责任公司 京ICP证150476号 | 京ICP备11018762号