
如何使条形图上的条形图直接向下浮动,但仅当滚动到该元素时?
如何使条形图上的条形图直接向下浮动,但仅当滚动到该元素时?
提问于 2022-12-01 00:56:28
我正在使用D3创建一个如下所示的条形图:
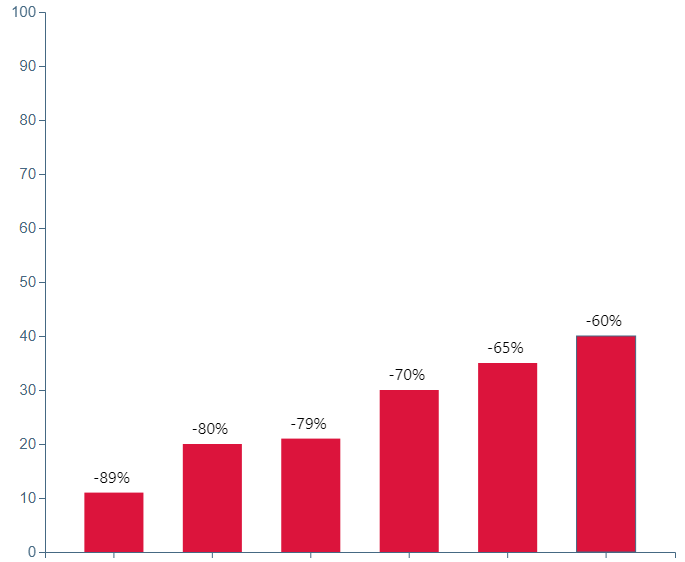
目前,从左上角的(由于D3坐标系)的角度上,这些条正在浮动。我希望这些条将直接向下浮动,但是只有当用户滚动到页面的那个部分时才会使用(注意:页面相当宽松,用户需要几分钟才能滚动到该元素)。
这是我的代码:
    let data = [
{"color": "Blue", "plotValue": 11},
{"color": "Red", "plotValue": 20},
{"color": "Orange", "plotValue": 21},
{"color": "Purple", "plotValue": 30},
{"color": "Green", "plotValue": 35},
{"color": "Violet", "plotValue": 40},
               ]


        vis.margin = {top: 70, right: 90, bottom: 90, left: 80};
        vis.width = 800 - vis.margin.left - vis.margin.right;

        // initialize the drawing area
        vis.svg = d3.select('#' + vis.parentElement).append('svg')
            .attr('width', vis.width + vis.margin.left + vis.margin.right)
            .attr('height', vis.height + vis.margin.top + vis.margin.bottom)
            .append('g')
            .attr('transform', `translate (${vis.margin.left}, ${vis.margin.top})`);


        // scales and axes
        vis.xScale = d3.scaleBand()
            .range( [ 0, vis.width ] )
            .padding(0.4);

        vis.yScale = d3.scaleLinear()
            .range( [ vis.height, 0 ] );

        vis.xAxis = d3.axisBottom()
            .scale(vis.xScale);

        vis.yAxis = d3.axisLeft()
            .scale(vis.yScale);

        // add chart title
        vis.svg.append('g')
            .attr('class', 'title bar-chart-title')
            .append('text')
            .text(vis.chartTitle)
            .attr('transform', `translate(${vis.width / 2 + 45}, -50)`)
            .attr('text-anchor', 'middle');

        // tooltip
        vis.tooltip = d3.select('body').append('div')
            .attr('class', 'tooltip')
            .attr('id', 'barChartTooltip');


        // create the axis groups
        vis.xAxisGroup = vis.svg.append('g')
            .attr('class', 'x-axis axis')
            .attr('transform', 'translate(0, ' + vis.height + ')');

        vis.yAxisGroup = vis.svg.append('g')
            .attr('class', 'y-axis axis');


        let vis = this;

        // update the domains
        vis.xScale.domain(vis.data.map(function (d) { return d.color; }));
        vis.yScale.domain( [ 0, 100 ] );

        // draw the bars
        vis.bars = vis.svg.selectAll('.bar')
            .data(vis.data)

        vis.bars.exit().remove();

        vis.bars
            .enter()
            .append('rect')
            .attr('class', 'bar')
            .on('mouseover', function(event, d) {
                d3.select(this)
                    .attr('stroke-width', '2px')
                    .attr('stroke', 'grey')
                    .attr('fill', 'blue')

                vis.tooltip
                    .style('opacity', 1)
                    .style('left', event.pageX + 20 + 'px')
                    .style('top', event.pageY + 'px')
                    .html(`
                    <div style='border: thin solid grey; border-radius: 5px; background: lightgrey; padding: 20px'>
                    <h3>${d.color}</h3>
                    <h4> ${100- d.plotValue.toLocaleString()}% decline </h4>
                    </div>

                    `)

            })
            .on('mouseout', function(event, d) {
                d3.select(this)
                    .attr('stroke-width', 1)
                    .attr('stroke', '#456983')
                    .attr('fill', function(d) {
                        return 'red'
                    })

                vis.tooltip
                    .style('opacity', 0)
                    .style('left', 0)
                    .style('top', 0)
                    .html(``);

            })
            .merge(vis.bars)
            .transition()
            .duration(1200)
            .attr('x', d => vis.xScale(d.color) )
            .attr('y', d => vis.yScale(d.plotValue) )
            .attr('width', vis.xScale.bandwidth() )
            .attr('height', function(d) { return vis.height - vis.yScale(d.plotValue); })
            .attr('fill', 'red')
//            .attr('stroke', 'grey');


        // add the axes
        vis.xAxisGroup
            .transition()
            .duration(500)
            .style('font-size', '15px')
            .style('color', 'blue')
            .call(d3.axisBottom((vis.xScale)))
            .selectAll('text')
            .attr('y', 30)
            .attr('x', -35)
            .attr('dy', '.35em')
            .attr('transform', 'rotate(-30)')
        ;

        vis.yAxisGroup
            .transition()
            .duration(500)
            .style('font-size', '15px')
            .style('color', 'blue')
            .call(d3.axisLeft(vis.yScale));

        vis.text = vis.svg.selectAll('.text')
            .data(vis.data)

        vis.text
            .enter()
            .append('text')
            .attr('class', 'text')
            .attr('text-anchor', 'middle')
            .attr('x', d => vis.xScale(d.color) + 27)
            .attr('y', d => vis.yScale(d.plotValue) - 10)
            .text( function (d) {
                return '-' + (100 - d.plotValue) + '%';
            })
我将如何修改我的代码,使条形图直接向下浮动,并且只有当用户滚动到页面的那个部分时才触发?
谢谢你能给出的任何建议!
Stack Overflow用户
回答已采纳
发布于 2022-12-01 01:11:33
没有像D3坐标系这样的东西,那就是SVG坐标系:0,0是左上角。
为了解决问题,您只需要在条形图进入时设置x、y和width属性,然后在转换中更改y和height属性。我相信显示条形图对用户来说更好,但是从顶部显示它们是很简单的(只需更改原始的y位置):
const vis = {};

vis.data = [{
    "color": "Blue",
    "plotValue": 11
  },
  {
    "color": "Red",
    "plotValue": 20
  },
  {
    "color": "Orange",
    "plotValue": 21
  },
  {
    "color": "Purple",
    "plotValue": 30
  },
  {
    "color": "Green",
    "plotValue": 35
  },
  {
    "color": "Violet",
    "plotValue": 40
  },
];


vis.margin = {
  top: 70,
  right: 90,
  bottom: 90,
  left: 80
};
vis.width = 800 - vis.margin.left - vis.margin.right;
vis.height = 400 - vis.margin.left - vis.margin.right;

// initialize the drawing area
vis.svg = d3.select("body").append('svg')
  .attr('width', vis.width + vis.margin.left + vis.margin.right)
  .attr('height', vis.height + vis.margin.top + vis.margin.bottom)
  .append('g')
  .attr('transform', `translate (${vis.margin.left}, ${vis.margin.top})`);


// scales and axes
vis.xScale = d3.scaleBand()
  .range([0, vis.width])
  .padding(0.4);

vis.yScale = d3.scaleLinear()
  .range([vis.height, 0]);

vis.xAxis = d3.axisBottom()
  .scale(vis.xScale);

vis.yAxis = d3.axisLeft()
  .scale(vis.yScale);

// add chart title
vis.svg.append('g')
  .attr('class', 'title bar-chart-title')
  .append('text')
  .text(vis.chartTitle)
  .attr('transform', `translate(${vis.width / 2 + 45}, -50)`)
  .attr('text-anchor', 'middle');

// tooltip
vis.tooltip = d3.select('body').append('div')
  .attr('class', 'tooltip')
  .attr('id', 'barChartTooltip');


// create the axis groups
vis.xAxisGroup = vis.svg.append('g')
  .attr('class', 'x-axis axis')
  .attr('transform', 'translate(0, ' + vis.height + ')');

vis.yAxisGroup = vis.svg.append('g')
  .attr('class', 'y-axis axis');

// update the domains
vis.xScale.domain(vis.data.map(function(d) {
  return d.color;
}));
vis.yScale.domain([0, 100]);

// draw the bars
vis.bars = vis.svg.selectAll('.bar')
  .data(vis.data)

vis.bars.exit().remove();

vis.bars
  .enter()
  .append('rect')
  .attr('class', 'bar')
  .attr('x', d => vis.xScale(d.color))
  .attr('y', d => vis.yScale(0))
  .attr('width', vis.xScale.bandwidth())
  .attr("height", 0)
  .on('mouseover', function(event, d) {
    d3.select(this)
      .attr('stroke-width', '2px')
      .attr('stroke', 'grey')
      .attr('fill', 'blue')

    vis.tooltip
      .style('opacity', 1)
      .style('left', event.pageX + 20 + 'px')
      .style('top', event.pageY + 'px')
      .html(`
                    <div style='border: thin solid grey; border-radius: 5px; background: lightgrey; padding: 20px'>
                    <h3>${d.color}</h3>
                    <h4> ${100- d.plotValue.toLocaleString()}% decline </h4>
                    </div>

                    `)

  })
  .on('mouseout', function(event, d) {
    d3.select(this)
      .attr('stroke-width', 1)
      .attr('stroke', '#456983')
      .attr('fill', function(d) {
        return 'red'
      })

    vis.tooltip
      .style('opacity', 0)
      .style('left', 0)
      .style('top', 0)
      .html(``);

  })
  .merge(vis.bars)
  .transition()
  .duration(1200)
  .attr('y', d => vis.yScale(d.plotValue))
  .attr('height', function(d) {
    return vis.height - vis.yScale(d.plotValue);
  })
  .attr('fill', 'red')
//            .attr('stroke', 'grey');


// add the axes
vis.xAxisGroup
  .transition()
  .duration(500)
  .style('font-size', '15px')
  .style('color', 'blue')
  .call(d3.axisBottom((vis.xScale)))
  .selectAll('text')
  .attr('y', 30)
  .attr('x', -35)
  .attr('dy', '.35em')
  .attr('transform', 'rotate(-30)');

vis.yAxisGroup
  .transition()
  .duration(500)
  .style('font-size', '15px')
  .style('color', 'blue')
  .call(d3.axisLeft(vis.yScale));

vis.text = vis.svg.selectAll('.text')
  .data(vis.data)

vis.text
  .enter()
  .append('text')
  .attr('class', 'text')
  .attr('text-anchor', 'middle')
  .attr('x', d => vis.xScale(d.color) + 27)
  .attr('y', d => vis.yScale(d.plotValue) - 10)
  .text(function(d) {
    return '-' + (100 - d.plotValue) + '%';
})<script src="https://d3js.org/d3.v7.min.js"></script>
关于只在用户到达SVG时才做动画的问题,这是一个完全不同的问题,请在此保留每个问题一个问题。因此,可以为这个单独的问题发布另一个问题(您不需要在这个新问题中使用d3.js标记)。
页面原文内容由Stack Overflow提供。腾讯云小微IT领域专用引擎提供翻译支持
原文链接:
https://stackoverflow.com/questions/74635784
复制相关文章
相似问题
腾讯云开发者
