
为什么我不能在我的线条图上设置宽度呢?
为什么我不能在我的线条图上设置宽度呢?
提问于 2022-12-01 16:27:56
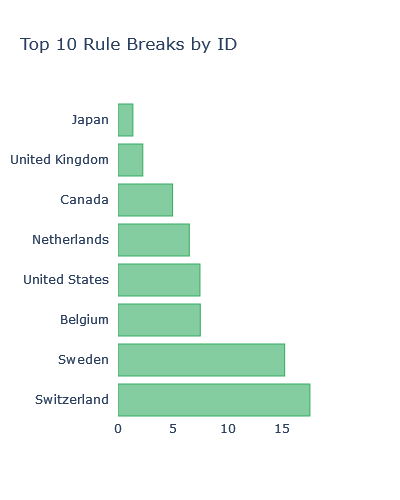
不管我怎么试.我似乎不能调整我的线条图的宽度。下面是我当前的代码和输出:
fig = go.Figure(go.Bar(
    x=top_10_belg['ID'],
    y=top_10_belg['Description'],
    marker=dict(color='rgba(50, 171, 96, 0.6)',
                line=dict(color='rgba(50, 171, 96, 1.0)',width=1))
    ,orientation='h'))

fig.update_layout(
    title='Top 10 Rule Breaks by ID',
    height = 500, width = 400,
    yaxis=dict(
        showgrid=False,
        showline=False,
        showticklabels=True
        ),
xaxis=dict(
        zeroline=False,
        showline=False,
        showticklabels=True,
        showgrid=False,
    ),barmode='group', bargap=0.4,bargroupgap=0.0,
paper_bgcolor='white',
    plot_bgcolor='white')

fig.update_yaxes(ticksuffix = "  ")
fig.update_yaxes(autorange="reversed")

fig.show()
由于保密,我不得不把标签排成一行。

回答 1
Stack Overflow用户
回答已采纳
发布于 2022-12-02 02:46:42
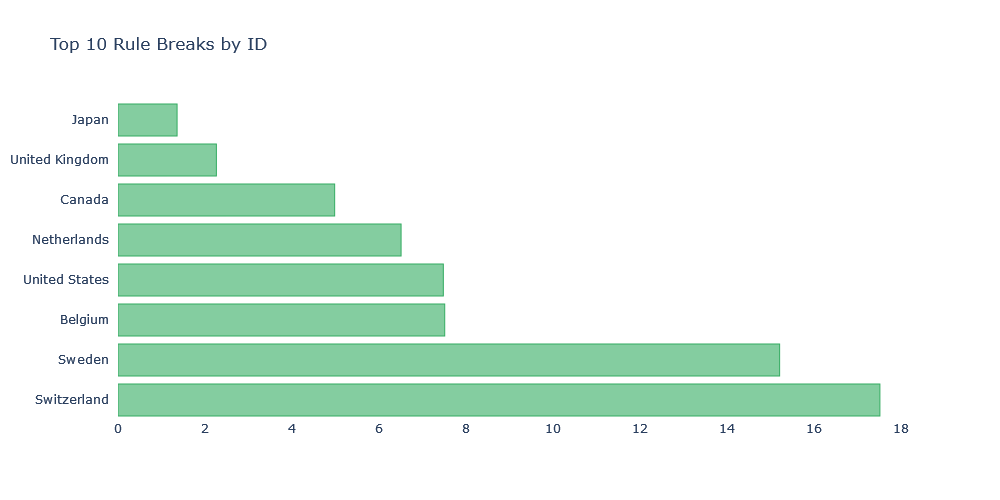
条形图的宽度由列表中的条形图数设置。值1.0将间隔设置为零。因此,作为一个例子,宽度0.8用于列出类别变量。我已经使用您的装饰在参考文献中复制了类似的水平条形图。
fig = go.Figure(go.Bar(
    x=top_10_belg['ID'],
    y=top_10_belg['Description'],
    width=[0.8]*len(top_10_belg['Description']), # update
    marker=dict(color='rgba(50, 171, 96, 0.6)',
                line=dict(color='rgba(50, 171, 96, 1.0)',
                          width=1)),
    orientation='h'))
由于增加x轴等于增加图形大小的宽度,所以可以通过添加以下代码来增加x轴的宽度。
fig.update_layout(autosize=True, width=1000)
页面原文内容由Stack Overflow提供。腾讯云小微IT领域专用引擎提供翻译支持
原文链接:
https://stackoverflow.com/questions/74645139
复制相关文章
相似问题
腾讯云开发者
