
ggplot2显示重复x轴勾标
ggplot2显示重复x轴勾标
提问于 2022-12-04 20:20:23
我有以下内容:
library(tibble)
library(ggplot2)
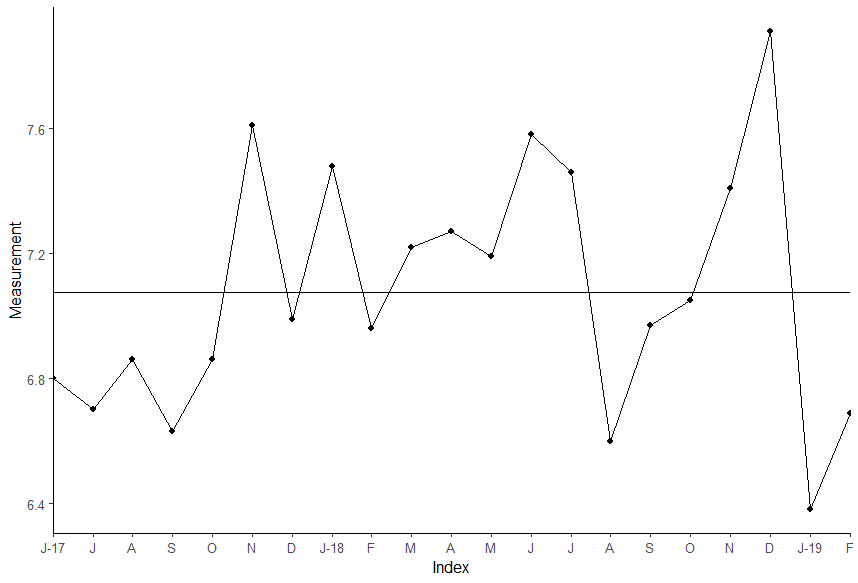
df <- tibble(
Time = c('J-17', 'J', 'A', 'S', 'O', 'N', 'D', 'J-18', 'F', 'M', 'A', 'M', 'J', 'J', 'A', 'S', 'O', 'N', 'D', 'J-19', 'F'),
Measurement = c(6.8, 6.7, 6.86, 6.63, 6.86, 7.61, 6.99, 7.48, 6.96, 7.22, 7.27, 7.19, 7.58, 7.46, 6.6, 6.97, 7.05, 7.41, 7.91, 6.38, 6.69)
)
# Added an index to df
df$Index <- 1:nrow(df)我是这样策划的:
    ggplot(df, aes(
      x = df$Index,
      y = df$Measurement,
    )) +
      geom_hline(yintercept = mean(df$Measurement)) +
      geom_line() +
      scale_x_discrete(expand = c(0,0), labels = df$Time) +
      theme_classic() +
geom_point()标签根本没有显示在x轴上。我在scale_x_discrete中正确地使用了scale_x_discrete吗?
Time包含重复的值,我希望保留这些值,并保持与df相同的顺序。
任何帮助都是非常感谢的!谢谢!
Stack Overflow用户
回答已采纳
发布于 2022-12-04 20:25:54
您不需要在aes中使用$,因为您已经引用了data.frame。它也是scale_x_continuous,因为x的变量是Index。
ggplot(
  data = df, aes(
    x = Index,
    y = Measurement)) +
  geom_hline(aes(yintercept = mean(Measurement))) +
  geom_line() +
  scale_x_continuous(expand = c(0,0),breaks = df$Index,labels = df$Time ) +
  theme_classic() +
  geom_point()
页面原文内容由Stack Overflow提供。腾讯云小微IT领域专用引擎提供翻译支持
原文链接:
https://stackoverflow.com/questions/74680573
复制相关文章
相似问题
腾讯云开发者
