
如何在pca双图中显示观测结果?
如何在pca双图中显示观测结果?
提问于 2021-11-16 10:02:39
我希望在主组件分析双图上显示观察行名,使用factoExtern外包。
library(factoextra)
## organize dataset to obtain unique rownames
iris$id <- rownames(iris)
iris$id <- paste(iris$Species, iris$id, sep="_")
rownames(iris) <- iris$id
iris <- iris[,1:4]
## Run PCA
pca <- prcomp(iris, center=T, scale. = T)
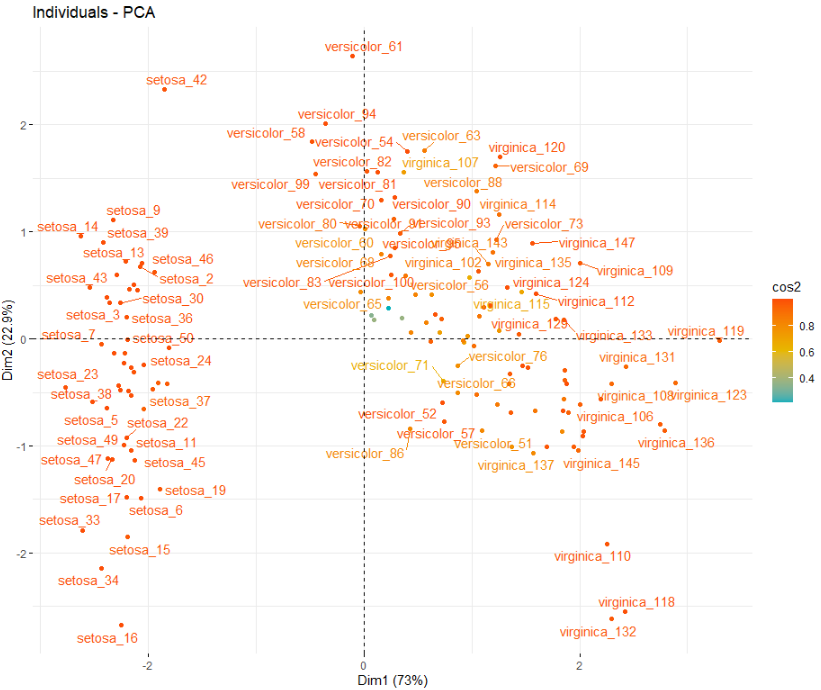
## On this plot observation names are displayed
fviz_pca_ind(pca,
col.ind = "cos2", # Color by the quality of representation
gradient.cols = c("#00AFBB", "#E7B800", "#FC4E07"),
repel = TRUE
))
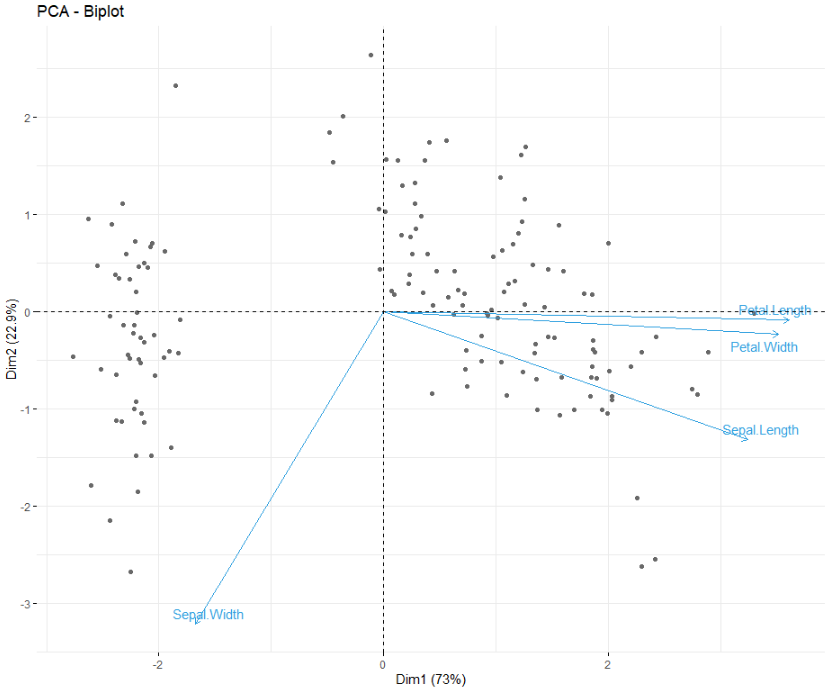
## Is there any way to display the same row names in this plot? (instead of points)
fviz_pca_biplot(pca,
            col.var = "#2E9FDF", # Variables color
            col.ind = "#696969",  # Individuals color
            label = 'var',
            repel = TRUE
)
提前感谢
回答 1
Stack Overflow用户
回答已采纳
发布于 2021-11-27 16:12:00
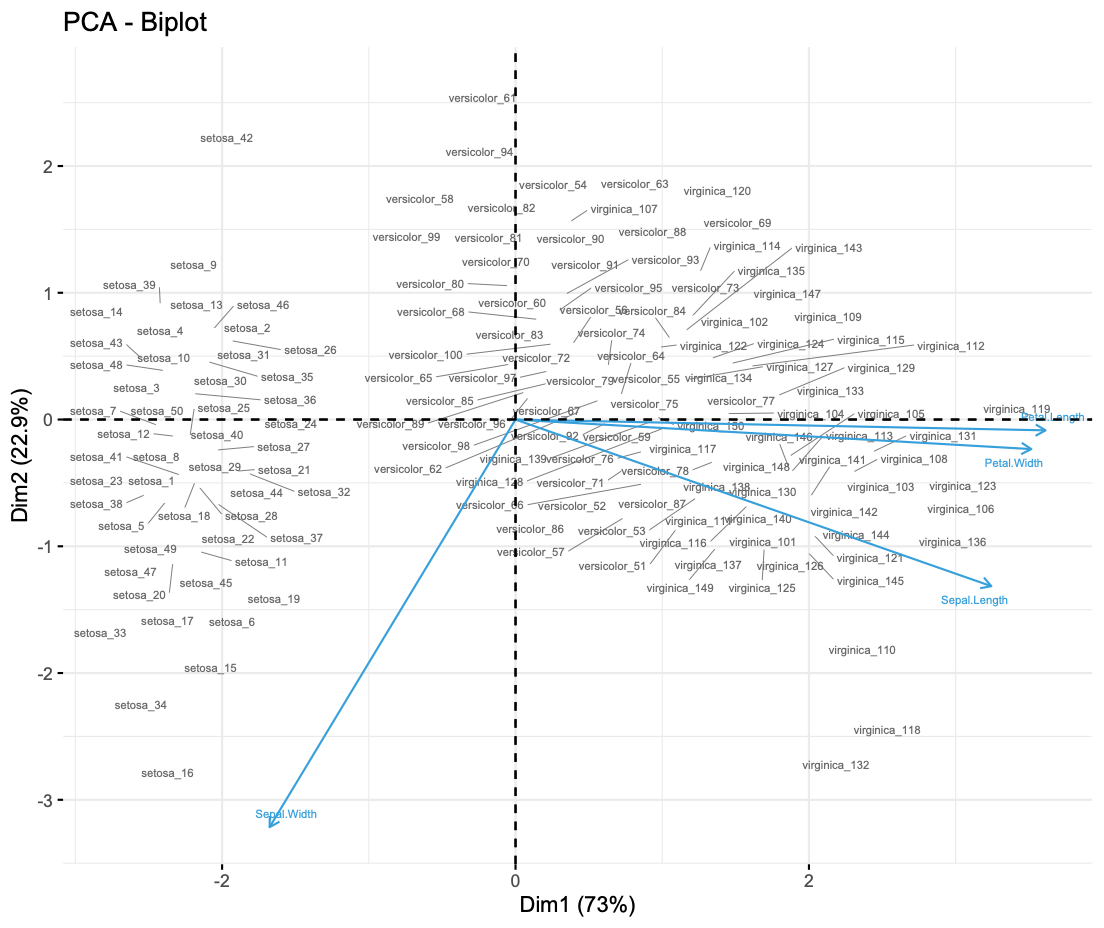
您可以指定geom.ind = "txt“
fviz_pca_biplot(pca,geom.ind="text",labelsize=2,
col.var = "#2E9FDF",col.ind = "#696969")
并尝试添加ggrepel:
options(ggrepel.max.overlaps = 20)
fviz_pca_biplot(pca,geom.ind="text",labelsize=2,
col.var = "#2E9FDF",col.ind = "#696969",repel=TRUE)
页面原文内容由Stack Overflow提供。腾讯云小微IT领域专用引擎提供翻译支持
原文链接:
https://stackoverflow.com/questions/69987091
复制相关文章
相似问题
腾讯云开发者
