
geom_segment()不存储在for循环中定义的对象值
geom_segment()不存储在for循环中定义的对象值
提问于 2021-10-05 15:39:14
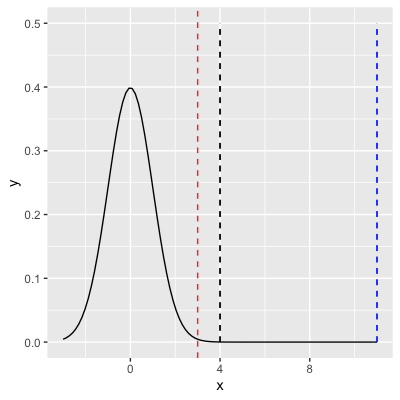
我定义了一个非常简单的for循环,在这个循环中,我用一条垂直红线和一个较小的垂直黑色段绘制一个正态分布。正态分布不变,但垂直线和垂直段的位置在每次迭代时都会发生变化。
如果在每次迭代后动态绘制ggplot()对象,则将正确显示行,但如果我将每个绘图存储在列表中,然后绘制列表,则垂直黑色段始终具有在最后一个循环中定义的值。请检查下面的解释:
set.seed(seed = 314159)

library(ggplot2)

plots_list <- list()

for (number in c(1:10)) {

  line <- number
  segment <- number + 1

  p <- ggplot(data = data.frame(x = c(-3, 3)),
              aes(x)) +
    stat_function(fun = dnorm,
                  n = 101,
                  args = list(mean = 0,
                              sd = 1)) +
    geom_vline(xintercept = line,
               colour = "red",
               size = 0.5,
               linetype = "dashed") +
    geom_segment(aes(x = segment,
                     xend = segment,
                     y = 0,
                     yend = 0.5),
                 linetype = "dashed")

  plot(p)

  plots_list[[number]] <- p

}

plots_list如果您在启动plot_list对象后检查这些图,您将看到每个图的红线更改位置,而黑色段则没有。有关于如何解决这个问题的建议吗?谢谢!
回答 1
Stack Overflow用户
回答已采纳
发布于 2021-10-05 15:59:22
你得干掉aes()。
最初的geom_segment()调用是蓝色的。annotate()注释掉的代码与没有aes()的geom_segment()一样工作。
set.seed(seed = 314159)

library(ggplot2)

plots_list <- list()

for (number in c(1:10)) {
  line <- number
  segment <- number + 1

  p <- ggplot(data = data.frame(x = c(-3, 3)),
              aes(x)) +
    stat_function(fun = dnorm,
                  n = 101,
                  args = list(mean = 0,
                              sd = 1)) +
    geom_vline(xintercept = line,
               colour = "red",
               size = 0.5,
               linetype = "dashed") +
    geom_segment(x = segment,           # the new segment is black
                 xend = segment,
                 y = 0,
                 yend = 0.5,
                 linetype = "dashed") +
    geom_segment(aes(x = segment,       # your original segment is blue
                     xend = segment,
                     y = 0,
                     yend = 0.5),
                 linetype = "dashed",
                 col = "blue")
    # annotate("segment",        # this works, too
    #          x = segment,
    #          xend = segment,
    #          y = 0,
    #          yend = 0.5,
    #          linetype = "dashed",
    #          col = "orange")

  plot(p)

  plots_list[[number]] <- p
}

plots_list
页面原文内容由Stack Overflow提供。腾讯云小微IT领域专用引擎提供翻译支持
原文链接:
https://stackoverflow.com/questions/69453459
复制相关文章
相似问题
腾讯云开发者
