
如何用gnuplot绘制一条光滑的直线通过一系列的点?
让我们假设一系列的点。如果我想通过这些点绘制一条平滑的曲线,我认为绘图选项smooth将完成这项工作。
来自help smooth
语法:
光滑的{唯一的\}
因此,Bézier曲线将不会通过点,但一些splines应该。但是,在gnu图中,splines需要单调的x-值。如果它们不是单调的,gnuplot就会使它们单调,并且(在这种情况下)会产生不期望的结果。
如何通过这些点画一条平滑的曲线?
示例:
### smooth curve through points?
reset session
set size ratio -1
$Data <<EOD
0 0
2 3
4 2
9 3
5 7
3 6
4 5
5 5
4 4
1 6
1 4
3 10
EOD
set key out
set ytics 1
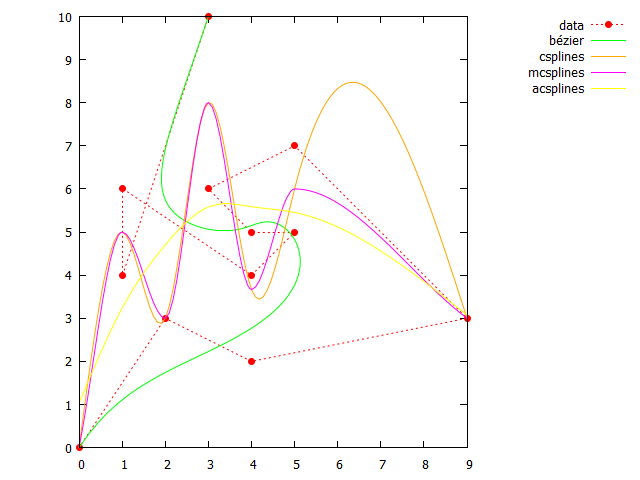
plot $Data u 1:2 w lp pt 7 lc "red" dt 3 ti "data", \
'' u 1:2 w l smooth bezier lc "green" ti "bézier", \
'' u 1:2 w l smooth csplines lc "orange" ti "csplines", \
'' u 1:2 w l smooth mcsplines lc "magenta" ti "mcsplines", \
'' u 1:2 w l smooth acsplines lc "yellow" ti "acsplines"
### end of code结果:(没有一个smooth选项会给出所需的结果)
回答 2
Stack Overflow用户
发布于 2021-09-03 08:14:06
编辑:这里是一个完全修改和缩短的版本:
- 它使用数组而不是数据库锁(如@Eldrad的解决方案中的)
- x,y坐标分别存储在复杂变量的实部和虚部。这使得参数计算比两个独立的x,y变量更短。
- 使用参数
r来调整曲线的形状。
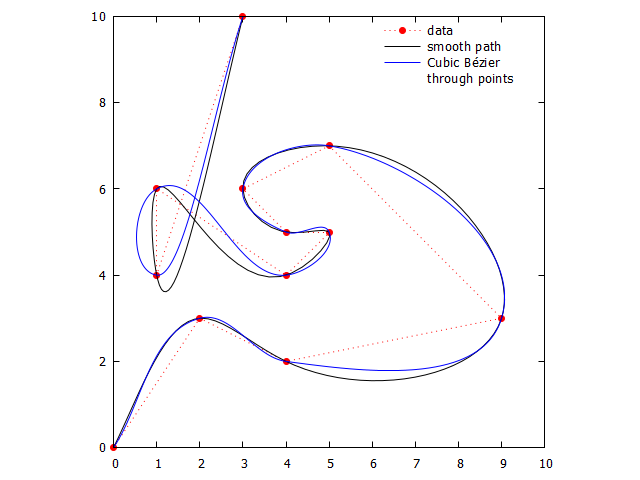
在我看来,通过给定点的“最佳”Bézier曲线是用参数r=0.333绘制的。正如@binzo所提到的,从gnuptut5.5开始,您可以使用smooth path选项进行比较。
脚本:(因为数组需要gnuplot>=5.2.0,smooth path需要gnuplot>=5.5 )
(如果有gnuplot<5.5,跳过第二行)
### plot cubix Bézier curve through given points
reset session

$Data <<EOD
0 0
2 3
4 2
9 3
5 7
3 6
4 5
5 5
4 4
1 6
1 4
3 10
EOD

set size ratio -1
set angle degrees
set key noautotitles reverse Left
set samples 200

colX     = 1
colY     = 2
j        = {0,1}                                 # imaginary unit
a(dx,dy) = dx==0 && dy==0 ? NaN : atan2(dy,dx)   # angle of segment between two points
L(dx,dy) = sqrt(dx**2 + dy**2)                   # length of segment
r        = 0.333                                 # relative distance of ctrl points

stats $Data u 0 nooutput   # get number of points+1
N = STATS_records+1
array P0[N]
array PA[N]
array PB[N]
array P1[N]

x1=x2=y1=y2=ap1=NaN
stats $Data u (x0=x1, x1=x2, x2=column(colX), i=int($0)+1, \
               y0=y1, y1=y2, y2=column(colY), P0[i]=x0+j*y0, \
               dx1=x1-x0, dy1=y1-y0, d1=L(dx1,dy1), dx1n=dx1/d1, dy1n=dy1/d1, \
               dx2=x2-x1, dy2=y2-y1, d2=L(dx2,dy2), dx2n=dx2/d2, dy2n=dy2/d2, \
               a1=a(dx1,dy1), a2=a(dx2,dy2), a1=a1!=a1?a2:a1, \
               ap0=ap1, ap1=a(cos(a1)+cos(a2),sin(a1)+sin(a2)), \
               PA[i]=x0+d1*r*cos(ap0) + j*(y0+d1*r*sin(ap0)), \
               PB[i]=x1-d1*r*cos(ap1) + j*(y1-d1*r*sin(ap1)), P1[i]=x1+j*y1, 0) nooutput
# add last segment
P0[i+1] = x1+j*y1
PA[i+1] = x1+d1*r*cos(ap1)+j*(y1+d1*r*sin(ap1))
PB[i+1] = x2-d2*r*cos(a2) +j*(y2-d2*r*sin(a2))
P1[i+1] = x2+j*y2

# Cubic Bézier function with t[0:1] as parameter between two points
# p0: start point, pa: 1st ctrl point, pb: 2nd ctrl point, p1: endpoint
p(i,t) = t**3 * (  -P0[i] + 3*PA[i] - 3*PB[i] + P1[i]) + \
         t**2 * ( 3*P0[i] - 6*PA[i] + 3*PB[i]        ) + \
         t    * (-3*P0[i] + 3*PA[i]                  ) + P0[i]

plot $Data u 1:2 w lp pt 7 lc "red" dt 3 ti "data", \
        '' u 1:2 smooth path w l lc "black" ti "smooth path", \
     for [i=2:|P0|] [0:1] '+' u (real(p(i,$1))):(imag(p(i,$1))) w l lc "blue" \
         ti i==2?("\nCubic Bézier\nthrough points"):''
### end of script
结果:
为了好玩,一个动画,改变参数r
Stack Overflow用户
发布于 2021-09-03 22:35:59
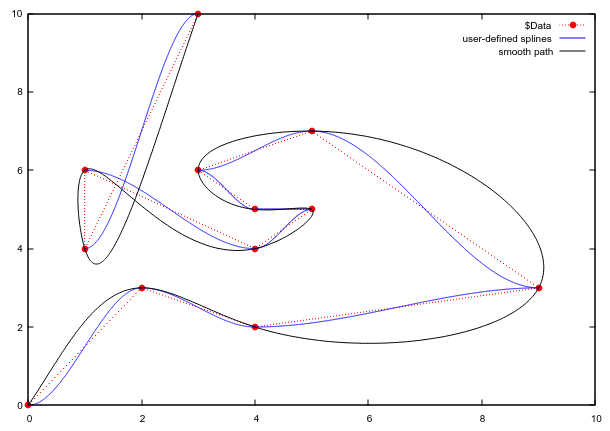
正如@binzo在注释中所写的那样,smooth path可能会给出所需的结果。我想分享我为个人需求开发的另一种方法,它类似于您自己的答案,手动定义平滑函数并遍历所有点。
在这里,我选择了一个样条,它连接两个连续的点,并水平地开始和结束(即它的导数at (x1,y1)和(x2,y2)是0)。
spline(x,x1,y1,x2,y2) = y1+x1**2*(y1-y2)*(3*x2-x1)/(x1-x2)**3 + 6*x1*x2*(y2-y1)/(x1-x2)**3*abs(x) + 3*(y1-y2)*(x1+x2)/(x1-x2)**3*abs(x)**2 + 2*(y2-y1)/(x1-x2)**3*abs(x)**3样条将在每一对连续点之间迭代绘制。为了做到这一点,可以方便地将数据块存储为数组,以便以后进行索引:
$Data <<EOD
0 0
2 3
4 2
9 3
5 7
3 6
4 5
5 5
4 4
1 6
1 4
3 10
EOD

stats $Data noout
array xvals[STATS_records]
array yvals[STATS_records]
do for [i=1:|xvals|] {
  stats $Data every ::i-1::i-1 u (xvals[i]=$1,yvals[i]=$2) noout
}在迭代图中,每个单一样条只在其各自的x1:x2范围内绘制。作为比较,还包括了smooth path。
plot $Data w lp pt 7 lc "red" dt 3,\
 for [i=1:|xvals|-1] [xvals[i]:xvals[i+1]] spline(x,xvals[i],yvals[i],xvals[i+1],yvals[i+1]) lc "blue" not,\
 keyentry w l lc "blue" t "user-defined splines",\
 $Data smooth path lc "black" t "smooth path"
或者,可以绕过转换为数组,直接访问数据块的元素。例如,$Data[2]将第二行作为字符串给出,该字符串可以由word()拆分。为了最终得到正确的浮点操作(而不是整数),数字必须由real()包装,这使得绘图命令更加庞大:
plot $Data w lp pt 7 lc "red" dt 3,\
 for [i=1:|$Data|-1] [word($Data[i],1):word($Data[i+1],1)] spline(x, real(word($Data[i],1)), real(word($Data[i],2)), real(word($Data[i+1],1)), real(word($Data[i+1],2)) ) w l lc "blue" not,\
 keyentry w l lc "blue" t "user-defined splines",\
 $Data smooth path lc "black" t "smooth path"
两个平滑选项中哪一个更好取决于您最终想要实现什么。显然,在两个连续点具有相同x值的情况下,样条尝试失败。
https://stackoverflow.com/questions/69041618
复制相似问题
腾讯云开发者
