
在facet_wrap中添加ggplot2下标和符号
在facet_wrap中添加ggplot2下标和符号
提问于 2021-08-25 16:16:34
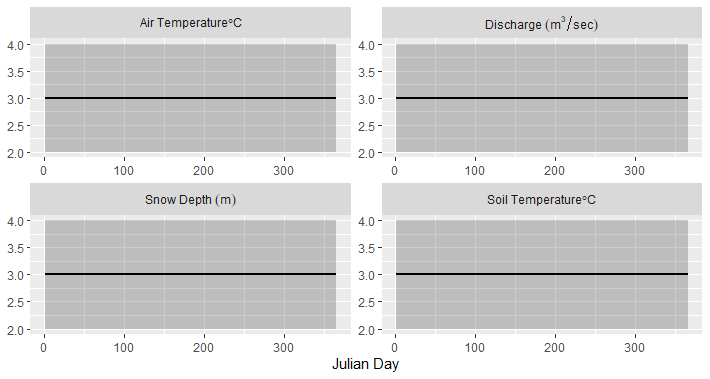
随着时间的推移,我试图创建一些天气状况的2x2面图,并且在为一些面标题添加学位符号和上标时遇到了困难。
weatherPLOT = data.frame(weather = rep(c("Soil Temperature (C)",
                                        "Snow Depth (m)",
                                        "Air Temperature (C)",
                                        "Discharge (m3/sec)"), each = 366),
                           day = 1:366,
                           mean = 3, # Obvious place holders,
                           Lo95 = 2, # Are actual numbers in real code
                           Hi95 = 4)

ggplot(aes(y = mean, x = day), data = weatherPLOT) +
  geom_ribbon(aes(ymin = Lo95, ymax = Hi95), alpha = 0.25) +
  geom_path(size = 1) +
  theme(axis.title.y = element_blank()) + xlab("Julian Day") +
  facet_wrap( ~ weather, nrow = 2, ncol = 2, scales = "free")
我知道诀窍是在facet_wrap内部使用标签器,但我不能让它工作-我只是想在(C)之前添加一个度符号,并使3 in (m3/秒)被迷信。
回答 1
Stack Overflow用户
发布于 2021-08-25 17:03:39
另一种方式是:
weatherPLOT %>%
  mutate(weather = factor(weather,
                          labels = c(bquote('Air Temperature'*degree*C),
                                     "Discharge~(m^{3}/sec)",
                                     "Snow~Depth~(m)",
                                     bquote('Soil Temperature'*degree*C)))) %>%
  ggplot(aes(y = mean, x = day)) +
  geom_ribbon(aes(ymin = Lo95, ymax = Hi95), alpha = 0.25) +
  geom_path(size = 1) +
  theme(axis.title.y = element_blank()) + xlab("Julian Day") +
  facet_wrap( ~ weather, nrow = 2, ncol = 2, scales = "free", labeller =  label_parsed)
页面原文内容由Stack Overflow提供。腾讯云小微IT领域专用引擎提供翻译支持
原文链接:
https://stackoverflow.com/questions/68926485
复制相关文章
相似问题
腾讯云开发者
