
R:将"vline“和"hline”语句组合在一起(ggplot2)
R:将"vline“和"hline”语句组合在一起(ggplot2)
提问于 2021-08-15 04:09:11
我正在使用R编程语言。最近,我学习了如何使用ggplot库“绘制”水平和垂直线:
library(ggplot2)
# Simple scatter plot
sp <- ggplot(data=mtcars, aes(x=wt, y=mpg)) + geom_point()
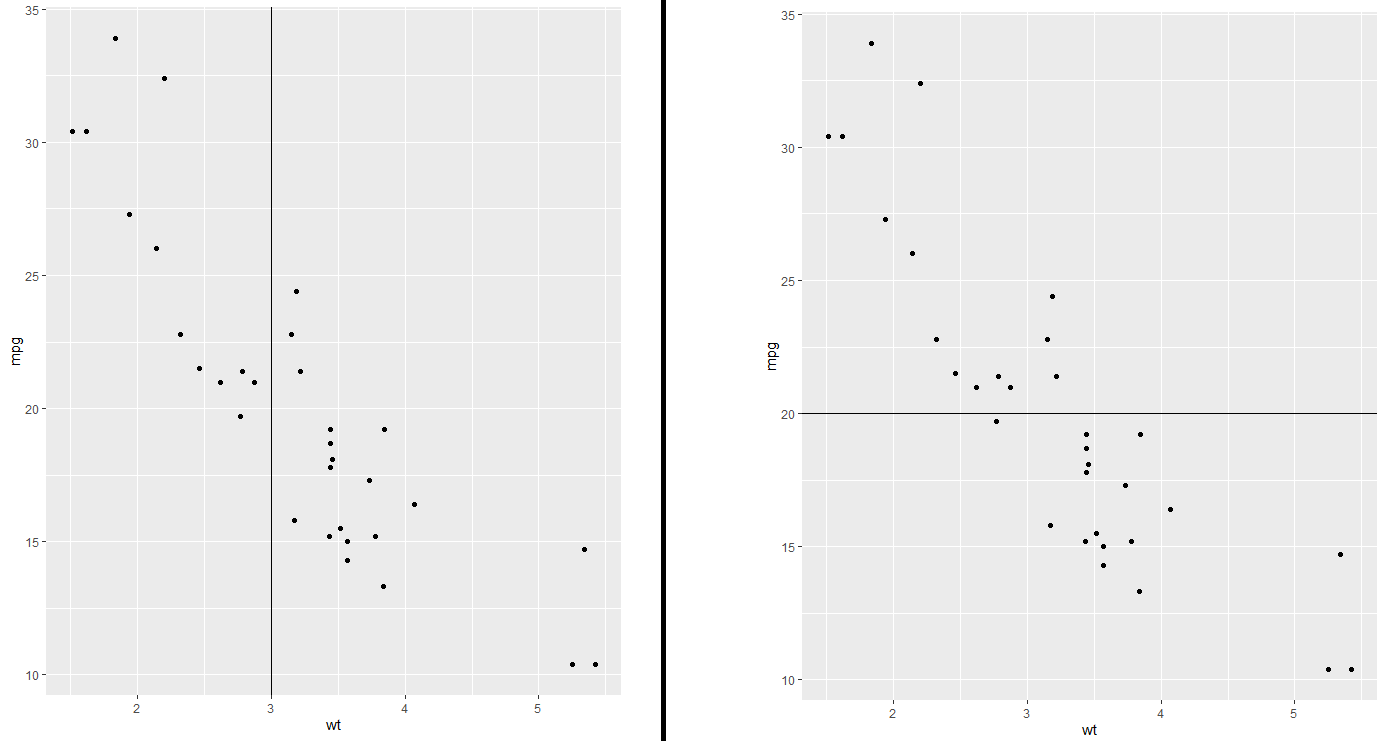
# Add horizontal line at y = 2O
a = sp + geom_hline(yintercept=20)
b = sp + geom_vline(xintercept = 3)
现在,我试图将这些声明组合在一起--例如:
c = sp + geom_hline(yintercept=20) +  geom_hline(yintercept=15) + geom_vline(xintercept = 3) +
    geom_vline(xintercept = 5) + geom_vline(xintercept = 6) + geom_hline(yintercept=35)
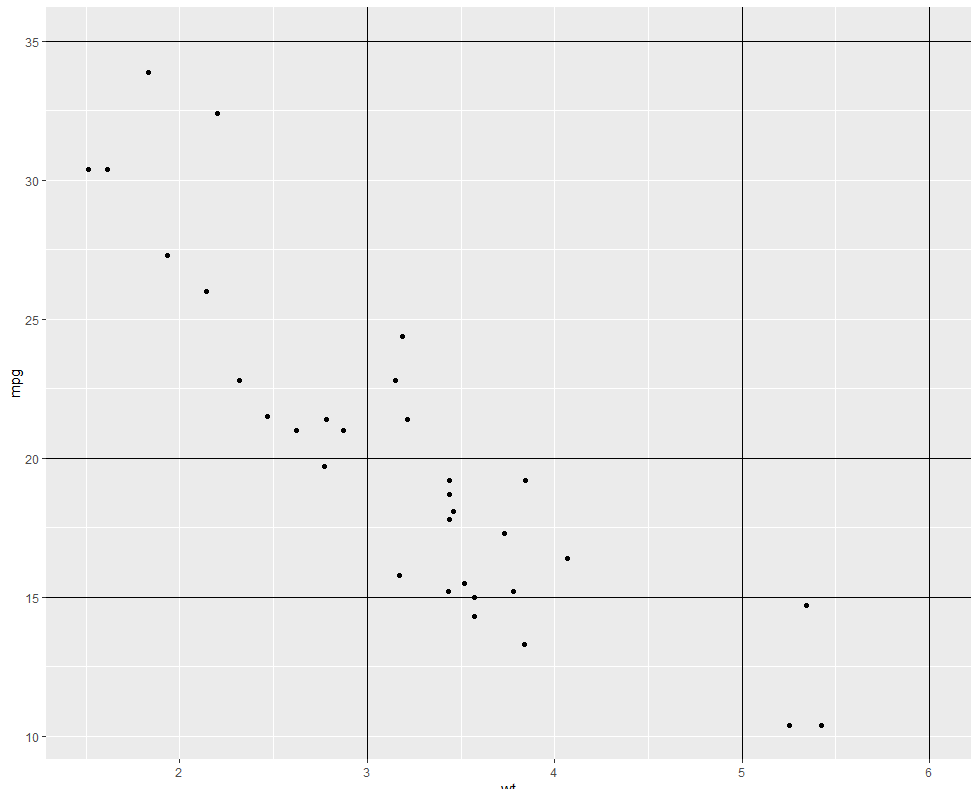
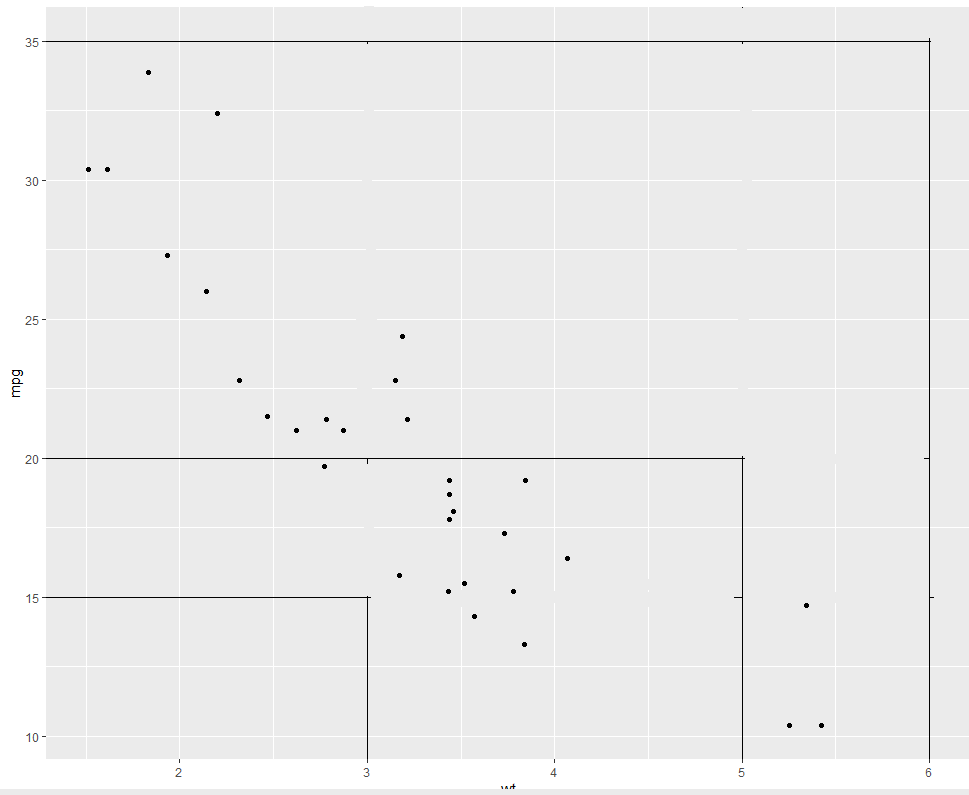
问题:,我试图修改上面的情节,使其看起来如下:
有人能告诉我怎么做吗?还是您必须手动将此地块导出到Microsoft中并在那里进行更改?
谢谢
回答 1
Stack Overflow用户
回答已采纳
发布于 2021-08-15 04:55:59
您可以使用annotate添加一个层。每个片段是下面四个向量的匹配元素。第一段从(-Inf,15)开始,以(3,15)结束。
ggplot(data=mtcars, aes(x=wt, y=mpg)) + geom_point() +
  annotate("segment",
           x = c(-Inf, 3, -Inf, 5, -Inf, 6),
           y = c(15, 15, 20, 20, 35, 35),
           xend = c(3, 3, 5, 5, 6, 6),
           yend = c(15, -Inf, 20, -Inf, 35, -Inf))
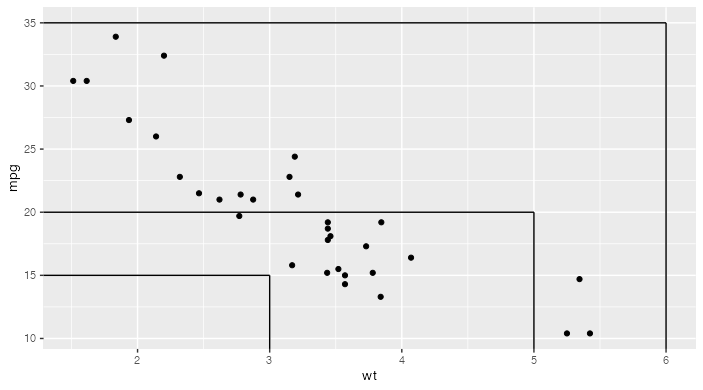
或者,定义一个从点到轴的两条线的函数可能更容易(假设这里的点是正的,所以它应该指向-Inf)。要使一个函数输出多个ggplot2元素,请将它们放在列表中:
draw_guides<- function(x, y) {
  list(geom_segment(aes(x = -Inf, xend = x, y = y, yend = y)),
       geom_segment(aes(x = x, xend = x, y = y, yend = -Inf)))
}
然后,您可以调用每个人,以便更容易地重新创建所需的图形:
ggplot(data=mtcars, aes(x=wt, y=mpg)) + geom_point() +
  draw_guides(3,15) +
  draw_guides(5,20) +
draw_guides(6,35)页面原文内容由Stack Overflow提供。腾讯云小微IT领域专用引擎提供翻译支持
原文链接:
https://stackoverflow.com/questions/68788647
复制相关文章
相似问题
腾讯云开发者
