
如何将非矩形和非网格的数据显示为具有gnuplot的地图?
如何将非矩形和非网格的数据显示为具有gnuplot的地图?
提问于 2021-07-24 06:45:16
让我们用x,y,z值给出以下100个点。
数据: (tbTriangulationTest.dat)
-7.6392 -11.107 84.8488
0.903339 9.3734 8.46736
-14.1859 20.7705 -294.647
1.70653 0.400903 0.684154
-7.15958 4.18987 -29.9977
-7.4528 4.57573 -34.102
-6.92655 12.5265 -86.7655
7.19843 12.2755 88.364
7.6977 4.97676 38.3096
7.7979 -12.6609 -98.7287
-7.05982 7.2656 -51.2938
-6.24214 -5.79787 36.1911
5.07354 -5.66814 -28.7575
2.14596 -24.9946 -53.6374
14.466 4.81118 69.5987
15.4306 -2.16115 -33.3478
11.1028 -1.0111 -11.2261
-11.4716 2.55607 -29.3223
-0.256364 14.5526 -3.73077
-6.83535 2.39029 -16.3385
3.19476 6.24488 19.9509
-7.72445 0.172802 -1.3348
-4.39985 7.86195 -34.5914
2.31929 13.8717 32.1724
2.4772 10.766 26.6694
-3.84819 0.687076 -2.644
-3.38394 2.43134 -8.22753
-14.4258 -0.320421 4.62232
0.359401 16.5257 5.93933
-0.11949 -6.9755 0.833503
0.0203191 14.5566 0.295777
5.26722 -10.3545 -54.5394
1.76742 3.98467 7.04257
-1.86885 13.3988 -25.0403
-1.07509 -7.08523 7.61723
7.47418 -7.07921 -52.9113
-0.109939 5.9067 -0.649376
-6.54697 2.69141 -17.6206
1.93999 6.87386 13.3352
9.99989 -5.95029 -59.5023
-8.83706 6.71112 -59.3066
6.74163 -1.71645 -11.5717
-4.12996 2.70168 -11.1578
6.29323 4.01845 25.289
18.2854 1.91548 35.0253
9.09857 12.9239 117.589
-9.01182 -11.5522 104.106
11.3029 -10.4565 -118.19
-24.4571 1.79031 -43.7857
19.34 -12.7014 -245.644
-10.2519 4.79582 -49.1662
6.24068 1.32636 8.27735
-15.0611 21.314 -321.012
12.2994 -22.9166 -281.861
4.53579 -3.02911 -13.7394
-2.30123 10.4506 -24.0492
-3.25415 -1.33511 4.34464
-0.235662 -7.96686 1.87749
21.0184 6.90852 145.206
0.643772 4.77797 3.07592
-13.3988 -7.69317 103.08
-2.49046 2.3838 -5.93674
-4.37109 -13.7552 60.1251
-3.29135 -4.70658 15.491
-5.11691 -18.2533 93.4004
12.3443 -11.7966 -145.621
13.0676 15.3554 200.659
17.5267 -15.0171 -263.202
2.71931 -3.37602 -9.18042
0.998506 -4.7515 -4.74441
-5.89248 3.18231 -18.7517
0.137122 -0.471599 -0.0646664
7.8984 20.8154 164.409
7.78891 -15.5838 -121.381
-9.83 -1.36857 13.453
9.36609 0.0750601 0.70302
-13.0303 -0.141129 1.83895
16.3977 -5.6081 -91.9598
2.33021 1.19008 2.77313
11.5595 -5.43006 -62.7686
-0.801337 14.7878 -11.85
5.32441 -5.41455 -28.8293
23.4373 14.0071 328.288
-17.7308 1.2621 -22.378
-0.820822 -7.65832 6.28611
-2.78152 15.6323 -43.4815
-0.294363 -2.24102 0.659673
20.2027 -4.30447 -86.962
-3.97186 9.53271 -37.8626
14.0495 -5.68544 -79.8777
1.8913 11.6477 22.0292
6.6496 0.813952 5.41246
8.37437 -6.54425 -54.804
4.78983 -9.09723 -43.5742
14.9403 -3.81761 -57.0361
-1.81065 -8.15522 14.7663
-11.7699 5.49208 -64.641
-8.61747 10.5284 -90.728
0.0274375 -7.02236 -0.192676
0.125369 5.45746 0.684198
现在,我想要绘制这些数据的高度图。通过下面的代码,我得到了下面的结果。
代码:
reset session

set term wxt size 630,630
FILE = "tbTriangulationTest.dat"

set view map
set palette rgb 33,13,10
set xrange [-30:25]
set yrange [-30:25]
set xtic 5
set ytic 5

set dgrid3d 100,100 gauss 5

splot FILE w pm3d
结果:
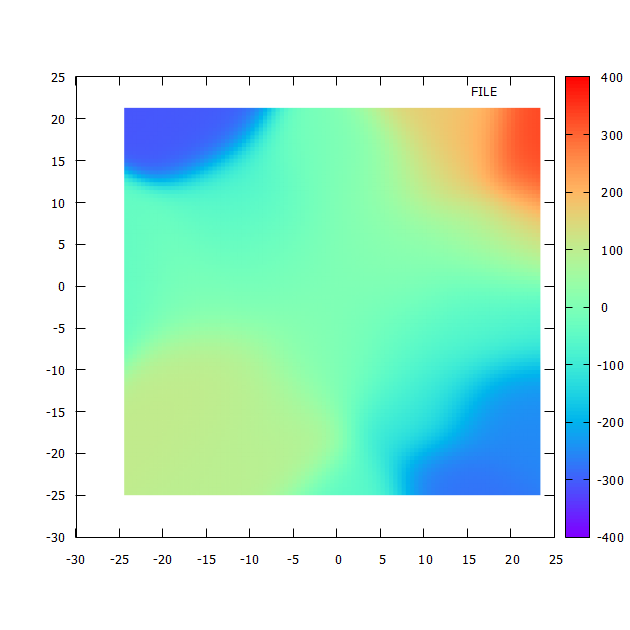
然而,在我看来,这张图看起来不错,但它并不一定给数据留下真实的印象,因为外部的区域将被着色,而实际上根本没有数据。这是矩形网格的结果。此外,取决于插值方法,可能存在伪影。
所以,我的问题是:
是否有更好的方法在gnuplot中显示非矩形和非网格的数据作为地图?
Stack Overflow用户
发布于 2021-07-24 06:45:16
到目前为止,我发现:一种常用的方法,例如在有限元模拟中,是网格或三角剖分。下面是对一组点的"Delaunay三角剖分“的gnuplot实现的尝试。三角剖分不过,我知道gnuplot并不是真正用于这样一个任务的工具。
因此,也许有更好的解决办法,我不知道。我很想了解他们。
Delaunay三角剖分:
下面的代码肯定不是获得三角剖分的最有效的方法,我们欢迎改进
程序(简写):
- 将N个数据点按x增加排序,如果相同的x,则按y增加排序。
- 找到第一个不共线的m>=3点
- 从m到N的循环点
( 3.1)查找与点m+1的连接不与任何当前船体段相交的所有船体点
3.2)将这些船体点连接到点m+1并相应地修改船体
- 循环所有内边
4.1)找出包含当前边的两个三角形。这些形成了一个四边形
4.2如果四边形是凸的,检查对角线是否需要翻转(“Lawson-翻转”)
4.3)重新开始,直到不再需要翻转
为了给三角形上颜色
- 将每个三角形分割成3个四边形,以质心为第4点。
- 根据各数据点的z值将三个子四边形着色。
评论:
- GnuWin没有原生排序功能(特别是按>=2列排序),因此您必须使用
sort(已经包含在Linux上,在sort上必须安装,例如从GnuWin安装CoreUtils)。 - 翻转边缘需要一些时间。我想,它是与
O(n^2)相结合的。因此,在超过100个数据点时,它就变得不实际了,因为它只需花费太长时间。但是似乎有一些算法应该在O(n log n)中运行。 - 改进是受欢迎的,或者甚至在great中的实现也是很棒的;)
代码:
### Delaunay triangulation (gnuplot implementation attempt, requires gnuplot 5.4)
reset session

# get some test data
Random=0        # set to 0 to read data from existing FILE
if (Random) {
    FILE = "tbTriangulationRandom.dat"
    set print FILE
    do for [i=0:99] {
        print sprintf("%g %g %g",x=invnorm(rand(0))*10,y=invnorm(rand(0))*10,x*y)
    }
    set print
}
else {
    FILE = "tbTriangulationTest.dat"
}

# sort data by x increasing values and if x is identical by increasing y values
set table $Data
    plot '<sort -n -k 1 -k 2 '.FILE u 1:2:3 w table
unset table

# definition of quite a few variables and functions
colX       = 1         # x column
colY       = 2         # y column
colZ       = 3         # z column
N          = |$Data|   # number of points
EDGES      = ''        # list of (inner) edges
HULL       = ''        # list of hull segments
TRIANGLES  = ''        # list of triangles
HULLPOINTS = ''        # list of hullpoints
array Px[N]            # set point array size
array Py[N]            # set point array size
array Pz[N]            # set point array size

newEdge(p1,p2)      = sprintf(" %d %d ",p1,p2)
Edge(n)             = sprintf(" %s %s ",word(EDGES,2*n-1),word(EDGES,2*n))
EdgeP(n,p)          = int(word(EDGES,2*n-2+p))
changeEdge(n,p1,p2) = (_edge=Edge(n), _pos = strstrt(EDGES,_edge), _pos ? \
                       EDGES[1:_pos-1].newEdge(p1,p2). \
                       EDGES[_pos+strlen(_edge):strlen(EDGES)] : EDGES)

TriangleCount(n)      = words(TRIANGLES)/3
TriangleN(n)          = sprintf(" %s %s %s ", \
                        word(TRIANGLES,3*n-2),word(TRIANGLES,3*n-1),word(TRIANGLES,3*n))
newTriangle(p1,p2,p3) = p1<p2 && p2<p3 ? sprintf(" %d %d %d ",p1,p2,p3) : \
                        p1<p3 && p3<p2 ? sprintf(" %d %d %d ",p1,p3,p2) : \
                        p2<p1 && p1<p3 ? sprintf(" %d %d %d ",p2,p1,p3) : \
                        p2<p3 && p3<p1 ? sprintf(" %d %d %d ",p2,p3,p1) : \
                        p3<p1 && p1<p2 ? sprintf(" %d %d %d ",p3,p1,p2) : \
                                         sprintf(" %d %d %d ",p3,p2,p1)
changeTA(n,p1,p2,p3)  = (TA=TriangleN(n), _pos = strstrt(TRIANGLES,TA), _pos ? \
                         TRIANGLES[1:_pos-1].newTriangle(p1,p2,p3). \
                         TRIANGLES[_pos+strlen(TA):strlen(TRIANGLES)] : TRIANGLES)

TAp(n,p)              = int(word(TRIANGLES,3*n-3+p))
TAx(n,p)              = Px[TAp(n,p)]                  # x-coordinate of point p of triangle n
TAy(n,p)              = Py[TAp(n,p)]                  # y-coordinate of point p of triangle n

HullP(n,p)            = int(word(HULL,2*n-2+p))   # hull segment point number
HScount(n)            = int(words(HULL))/2        # number of hull segments
getHullPoints(n)      = (_tmp = '', sum [_i=1:words(HULL)] ((_s=' '.word(HULL,_i).' ', _tmp = \
                         strstrt(_tmp,_s) ? _tmp : _tmp._s ), 0), _tmp)
removeFromHull(seg)   = (seg, _pos = strstrt(HULL,seg), _pos ? \
                         HULL[1:_pos-1].HULL[_pos+strlen(seg):strlen(HULL)] : HULL)

# orientation of 3 points, either -1=clockwise, 0=collinear, 1=counterclockwise
Orientation(p1,p2,p3) = sgn((Px[p2]-Px[p1])*(Py[p3]-Py[p1]) - (Px[p3]-Px[p1])*(Py[p2]-Py[p1]))

# check for intersection of segment p1-p2 with segment p3-p4, 0=no intersection, 1=intersection
IntersectCheck(p1,p2,p3,p4) = (Orientation(p1,p3,p2)==Orientation(p1,p4,p2)) || \
                                 (Orientation(p3,p1,p4)==Orientation(p3,p2,p4)) ? 0 : 1

Sinus(p1,p2)          = (_dx=Px[p2]-Px[p1], _dy=Py[p2]-Py[p1], _dy/sqrt(_dx**2 + _dy**2))

### Macros for later use
# Creating inner edges datablock macro
CreateEdgeDatablock = '\
set print $EDGES; \
do for [i=1:words(EDGES)/2] { \
    p1 = int(word(EDGES,2*i-1)); \
    p2 = int(word(EDGES,2*i)); \
    print sprintf("%g %g %g %g %d %d",Px[p1],Py[p1],Px[p2]-Px[p1],Py[p2]-Py[p1],p1,p2) \
}; \
set print '

# Creating hull datablock macro
CreateHullDatablock = '\
set print $HULL; \
do for [i=1:words(HULL)/2] { \
    p1 = int(word(HULL,2*i-1)); \
    p2 = int(word(HULL,2*i));   \
    print sprintf("%g %g %g %g %d %d",Px[p1],Py[p1],Px[p2]-Px[p1],Py[p2]-Py[p1],p1,p2) \
}; \
set print '

# plotting everything
PlotEverything = '\
plot $EDGES u 1:2:3:4 w vec lw 1.0 lc "red" nohead, \
      $HULL u 1:2:3:4 w vec lw 1.5 lc "blue" nohead, \
      $Data u 1:2 w p pt 7 ps 0.5 lc "black", \
      $Data u 1:2:($0+1) w labels offset 0.5,0.5 '

# put datpoints into arrays
set table $Dummy
    plot $Data u (Px[int($0)+1]=column(colX),Py[int($0)+1]=column(colY),Pz[int($0)+1]=column(colZ),'') w table
unset table

# get first m>=3 points which are not all collinear
HULL = HULL.newEdge(1,2)                # add first 2 points to hull in any case
do for [p=3:N] {
    if (Orientation(p-2,p-1,p)==0) {    # orientation==0 if collinear
        HULL = HULL.newEdge(p-1,p)
    }
    else { break }                      # stop if first >=3 non-collinear points found
}
HPcountInit = words(getHullPoints(0))   # get initial number of hull points

# actual plotting starts from here

set offset 1,1,1,1
set key noautotitle
set palette rgb 33,13,10
set rmargin screen 0.8

plot $Data u 1:2 w p pt 7 ps 0.5 lc "black", \
        '' u 1:2:($0+1) w labels offset 0.5,0.5

set label 1 at graph 0.02,0.97 "Adding points... "

# loop all data points
do for [p=HPcountInit+1:N] {
    print sprintf("### Adding P%d",p)
    HPlist = getHullPoints(0)
    HPcount = words(HPlist)
    set print $NewConnections   # initalize/empty datablock for new connections
        print ""
    set print
    do for [hpt in HPlist] {          # loop and check all hull points
        hp = int(hpt)
        # print sprintf("Check hull point P%d", hp)
        c = 0
        do for [hs=1:HScount(0)] {               # loop all hull segments
            hp1 = HullP(hs,1)
            hp2 = HullP(hs,2)
            # print sprintf("Check %d-%d with %d-%d", hp1, hp2, hp, p)
            if (p!=hp1 && p!=hp2 && hp!=hp1 && hp!=hp2) {
                c = c || IntersectCheck(hp1,hp2,hp,p)
                if (c) { break }
            }
        }
        if (c==0) {                 # if no intersections with hull
            set print $NewConnections append            # add new connections to datablock
                print sprintf("%g %g", hp, Sinus(p,hp))
            set print
        }
    }

    # sort datablock clockwise (a bit cumbersome in gnuplot)
    set table $ConnectSorted
        plot $NewConnections u 1:2:2 smooth zsort    # requires gnuplot 5.4.0
    set table $Dummy
        plot Connect='' $ConnectSorted u (Connect=Connect.sprintf(" %d",$1),'') w table
    unset table

    # add new edges
    Ccount = int(words(Connect))
    do for [i=1:Ccount-1] {
        p1 = int(word(Connect,i))
        p2 = int(word(Connect,i+1))
        TRIANGLES = TRIANGLES.sprintf(" %d %d %d ", p1<p2?p1:p2, p2<p1?p1:p2, p)  # numbers in ascending order
        if (i==1) { HULL=HULL.newEdge(p1,p) }
        if (i>1 && i<Ccount) { EDGES = EDGES.newEdge(p1,p) }
        if (i==Ccount-1) {
            HULL  = HULL.newEdge(p2,p)
        }
        if (p!=HPcountInit+1) {          # remove hull segments, except initial ones
            NewEdge = p1<p2 ? sprintf(" %d %d ",p1,p2) : sprintf(" %d %d ",p2,p1)
            # print sprintf("Remove %s",NewEdge)
            HULL = removeFromHull(NewEdge)
            EDGES = EDGES.NewEdge
            @CreateEdgeDatablock
            @CreateHullDatablock
            @PlotEverything
        }
    }
}


# flip diagonal of a quadrangle if Det(p1,p2,p3,p4) and Orientation(p1,p2,p3) have the same sign
#
m11(p1,p4) = Px[p1]-Px[p4]
m21(p2,p4) = Px[p2]-Px[p4]
m31(p3,p4) = Px[p3]-Px[p4]

m12(p1,p4) = Py[p1]-Py[p4]
m22(p2,p4) = Py[p2]-Py[p4]
m32(p3,p4) = Py[p3]-Py[p4]

m13(p1,p4) = (Px[p1]-Px[p4])**2 + (Py[p1]-Py[p4])**2
m23(p2,p4) = (Px[p2]-Px[p4])**2 + (Py[p2]-Py[p4])**2
m33(p3,p4) = (Px[p3]-Px[p4])**2 + (Py[p3]-Py[p4])**2

Det(p1,p2,p3,p4) = m11(p1,p4)*(m22(p2,p4)*m33(p3,p4) - m32(p3,p4)*m23(p2,p4)) + \
                   m12(p1,p4)*(m23(p2,p4)*m31(p3,p4) - m33(p3,p4)*m21(p2,p4)) + \
                   m13(p1,p4)*(m21(p2,p4)*m32(p3,p4) - m31(p3,p4)*m22(p2,p4))

# create triangle data
set print $Triangles
    do for [i=1:TriangleCount(0)] {
        print sprintf("%g %g",TAx(i,1),TAy(i,1))
        print sprintf("%g %g",TAx(i,2),TAy(i,2))
        print sprintf("%g %g",TAx(i,3),TAy(i,3))
        print sprintf("%g %g",TAx(i,1),TAy(i,1))
        print ""
    }
unset print

@CreateEdgeDatablock
@CreateHullDatablock
@PlotEverything

set label 1 "Flipping diagonals... "

###
# loop edges and check if need to flip. If on edge was flipped, start over again.
flip = 0
flipCount = 0
flippedAtLeastOnce = 1
while (flippedAtLeastOnce) {
    flippedAtLeastOnce=0
    do for [e=1:words(EDGES)/2] {               # loop all inner edges
        # find the 2 triangles with this edge
        p1 = EdgeP(e,1)
        p2 = EdgeP(e,2)
        found = 0
        do for [t=1:TriangleCount(0)] {         # loop all triangles
            tap1 = TAp(t,1)
            tap2 = TAp(t,2)
            tap3 = TAp(t,3)
            p = p1==tap1 ? p2==tap2 ? tap3 : p2==tap3 ? tap2 : 0 : p1==tap2 ? p2==tap3 ? tap1 : 0 : 0
            # print sprintf("%d %d %d: %d",tap1,tap2,tap3,p)
            if (p!=0) {
                if (found==1) {
                    ta2=t; p4=p;
                    flip  = sgn(Det(p1,p2,p3,p4))==Orientation(p1,p2,p3)
                    flippedAtLeastOnce = flippedAtLeastOnce || flip
                    if (flip) {
                        flipCount = flipCount+1
                        print sprintf("Flip % 3d: %d-%d with %d-%d",flipCount,p1,p2,p3,p4)
                        EDGES     = changeEdge(e,p3,p4)
                        TRIANGLES = changeTA(ta1,p1,p3,p4)
                        TRIANGLES = changeTA(ta2,p2,p3,p4)
                        @CreateEdgeDatablock
                        @CreateHullDatablock
                        @PlotEverything
                        break           # start over again
                    }
                }
                if (found==0) { ta1=t; p3=p; found=1}
            }
        }
    }
}
###

# create quadrangles datablock
Center2x(p1,p2)    = (Px[p1]+Px[p2])/2.          # x-center of 2 points
Center2y(p1,p2)    = (Py[p1]+Py[p2])/2.          # y-center of 2 points
Center3x(p1,p2,p3) = (Px[p1]+Px[p2]+Px[p3])/3.   # x-center between 3 points
Center3y(p1,p2,p3) = (Py[p1]+Py[p2]+Py[p3])/3.   # x-center between 3 points

set print $QUADRANGLES
    do for [i=1:TriangleCount(0)] {
        do for [p=0:2] {
            z = Pz[TAp(i,p+1)]
            tap1 = TAp(i,p+1)
            tap2 = TAp(i,(p+1)%3+1)
            tap3 = TAp(i,(p+2)%3+1)
            print sprintf("%g %g %g", Px[tap1], Py[tap1], z)
            print sprintf("%g %g %g", Center2x(tap1,tap2), Center2y(tap1,tap2), z)
            print sprintf("%g %g %g", Center3x(tap1,tap2,tap3), Center3y(tap1,tap2,tap3), z)
            print sprintf("%g %g %g", Center2x(tap1,tap3), Center2y(tap1,tap3), z)
            print sprintf("%g %g %g", Px[tap1], Py[tap1], z)
            print ''
        }

    }
set print

set label 1 "Coloring areas."

plot $QUADRANGLES u 1:2:3 w filledcurves closed lc palette, \
     $EDGES u 1:2:3:4 w vec lw 1.0 lc "grey" nohead, \
     $HULL u 1:2:3:4 w vec lw 1.5 lc "blue" nohead, \
     $Data u 1:2:3 w p pt 7 ps 0.5 lc palette
### end of code
结果:
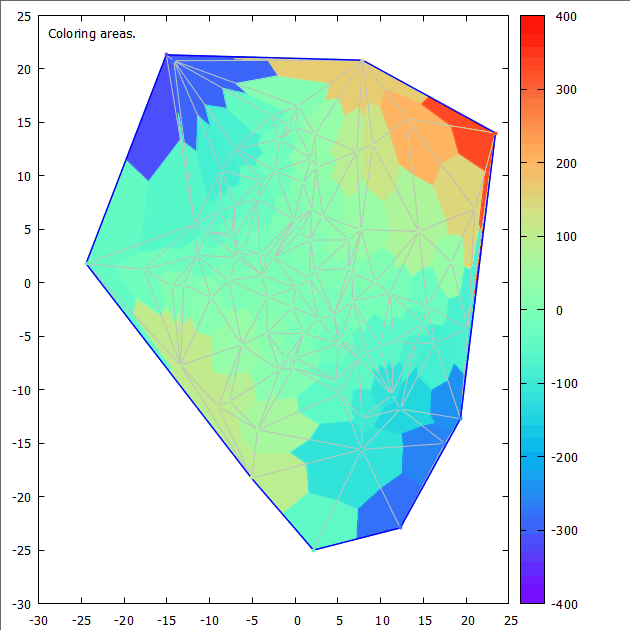
动画:(实际上,在我的旧笔记本电脑上大约需要3分钟)
页面原文内容由Stack Overflow提供。腾讯云小微IT领域专用引擎提供翻译支持
原文链接:
https://stackoverflow.com/questions/68507660
复制相关文章
相似问题
腾讯云开发者
