
在pdf中显示的条形图条形图值低于Y轴值?
在pdf中显示的条形图条形图值低于Y轴值?
提问于 2021-07-08 17:43:26
我创建了一个逐行图表js,下面是我的代码
版本: 2.9.4
var xValues = ["Italy", "France", "Spain", "USA", "Argentina"];
var yValues = [3, 5, 8, 9, 5];
var barColors = ["#E85900", "#E85900","#E85900","#E85900","#E85900"];

new Chart("myChart", {
  type: "bar",
  data: {
    labels: xValues,
    datasets: [{
      axis: 'y',
      backgroundColor: barColors,
      data: yValues,
    }]
  },
  options: {
    legend: {display: false},
    scales: {
        xAxes: [{
            barThickness: 65,  // number (pixels) or 'flex'
        }],
        yAxes: [{
            ticks: {
                stepSize: 1,
                beginAtZero:true,
                suggestedMax: 9
            }
        }]
    },
    plugins: {
      datalabels: {
        anchor: 'end',
        align: 'top',
        formatter: Math.round,
        font: {
          weight: 'bold'
        }
      }
    }
  }
});
输出,我得到了如下在pdf,我使用wkhtmltopdf。但在html页面上没问题。
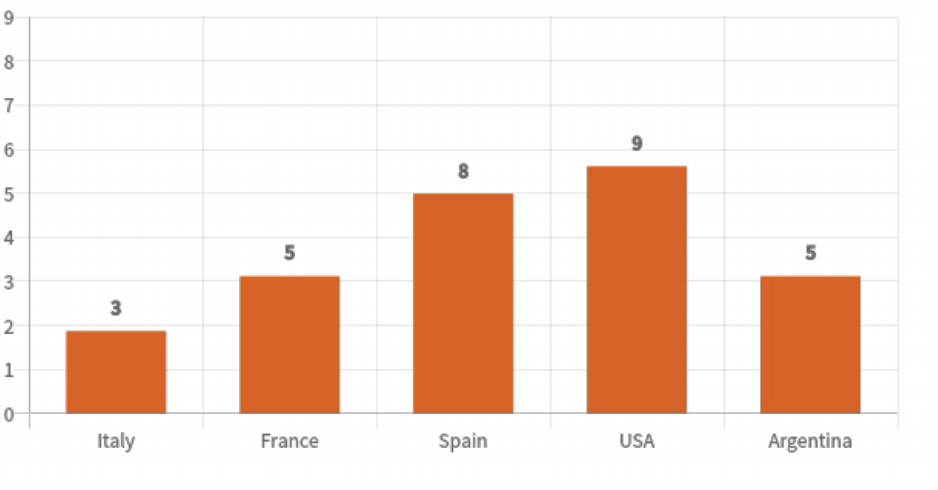
问题是显示小于Y轴值的条形尺寸。这里的杆值3显示在Y轴值3下,我的期望是它等于3。
回答 1
Stack Overflow用户
发布于 2022-04-22 07:46:37
在IronPdf中将html转换为pdf时,我也遇到了类似的问题。我已经通过将动画选项设置为false来解决这个问题。所以在你的情况下应该是:
var xValues = ["Italy", "France", "Spain", "USA", "Argentina"];
var yValues = [3, 5, 8, 9, 5];
var barColors = ["#E85900", "#E85900","#E85900","#E85900","#E85900"];

new Chart("myChart", {
  type: "bar",
  data: {
    labels: xValues,
    datasets: [{
      axis: 'y',
      backgroundColor: barColors,
      data: yValues,
    }]
  },
  options: {
    animation: false,
    legend: {display: false},
    scales: {
        xAxes: [{
            barThickness: 65,  // number (pixels) or 'flex'
        }],
        yAxes: [{
            ticks: {
                stepSize: 1,
                beginAtZero:true,
                suggestedMax: 9
            }
        }]
    },
    plugins: {
      datalabels: {
        anchor: 'end',
        align: 'top',
        formatter: Math.round,
        font: {
          weight: 'bold'
        }
      }
    }
  }
});页面原文内容由Stack Overflow提供。腾讯云小微IT领域专用引擎提供翻译支持
原文链接:
https://stackoverflow.com/questions/68306408
复制相关文章
相似问题
腾讯云开发者
