
在SVG路径上找到一个点
在SVG路径上找到一个点
提问于 2021-04-30 09:30:47
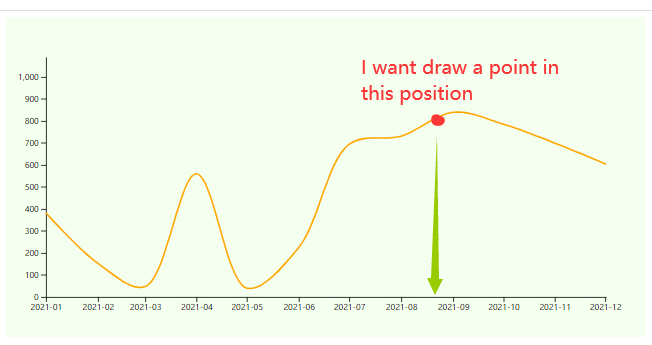
我用d3js画了一条平滑的曲线。然后,我想在曲线上画一个点,但是这个点是随机的,我只有x值。我要得到函数表达式,用x值得到y值。有什么方法可以得到y值吗?
const line = d3.line()
  .x(d => xScale(new Date(d.name)))
  .y(d => yScale(d.value1))
  .curve(d3.curveCatmullRom);
const series = svg.append('g')
  .attr('transform', `translate(${grid.left},${grid.top})`)
  .append('path')
  .attr('d', line(data))
  .attr('fill', 'transparent')
  .attr('stroke-width', 2)
  .attr('stroke', 'orange');
我目前的图表:
回答 2
Stack Overflow用户
回答已采纳
发布于 2021-04-30 11:56:32
下面是一个函数,它在x坐标指定的<path> (二进制搜索)上找到一个点:
注记:路径在X上应该是单调的(在路径上,不能是2点,且x是相同的)
const findPointAt = (path, x) => {
  let from = 0;
  let to = path.getTotalLength();
  let current = (from + to) / 2;
  let point = path.getPointAtLength(current);

  while (Math.abs(point.x - x) > 0.5) {
    if (point.x < x)
      from = current;
    else
      to = current;
    current = (from + to) / 2;
    point = path.getPointAtLength(current);
  }
  return point;
}


const path = d3.select('path').node();

for (let x = 0; x <= 200; x += 50) {
  const pos = findPointAt(path, x);
  console.log(pos);
  d3.select('svg').append('circle')
    .attr('cx', pos.x)
    .attr('cy', pos.y)
    .attr('r', 3)
}svg {
border: 1px solid gray;
}
path {
fill: none;
stroke: blue;
}
circle {
fill: red;
}<script src="https://cdnjs.cloudflare.com/ajax/libs/d3/5.7.0/d3.min.js"></script>
<svg width="200" height="150">
<path d="M 0,10 Q 40,0 90,80 C 120,120 150,70 220,20" />
</svg>
Stack Overflow用户
发布于 2021-04-30 12:13:26
这真的是this的翻版,但是我添加了一个片段,因为这个帖子已经有好几年的历史了。
const margin = 30;
const width = 400;
const height = 180;
const chartWidth = width - (margin * 2);
const chartHeight = height - (margin * 2);

const data = Array.from({length: 10}, (v, i) => {
  return {
    index: i,
    value: Math.floor(Math.random() * 20) + 4
  }
});

const svg = d3.select("#viz")
  .append("svg")
  .attr("width", width)
  .attr("height", height);

const xScale = d3.scaleLinear()
  .domain(d3.extent(data, d => d.index))
  .range([0, chartWidth]);

svg.append("g")
  .attr("class", "x-axis")
  .attr("transform", `translate(${margin},${height - margin})`)
  .call(d3.axisBottom(xScale));

const yScale = d3.scaleLinear()
  .domain(d3.extent(data, d => d.value))
  .range([chartHeight, 0]);

svg.append("g")
  .attr("class", "y-axis")
  .attr("transform", `translate(${margin},${margin})`)
  .call(d3.axisLeft(yScale));

const line = d3.line()
  .x(d => xScale(d.index))
  .y(d => yScale(d.value))
  .curve(d3.curveCatmullRom);

const series = svg.append("g")
  .attr("transform", `translate(${margin},${margin})`)
  .append("path")
  .attr("d", line(data))
  .attr("fill", "transparent")
  .attr("stroke-width", 2)
  .attr("stroke", "orange");

const findYFromXLinearTime = (x, line) => {
  const getXYAtLength = len => {
    const pt = line.getPointAtLength(len);
    return {x: pt.x, y: pt.y};
  }
  let l = 0;
  while (getXYAtLength(l).x < x) l+=0.01;
  return getXYAtLength(l).y;
}

const findYFromXLogTime = (x, line) => {
  const error = 0.01;
  const iterMax = 50;
  let iter = 0;
  let start = 0;
  let end = line.getTotalLength();
  let point = line.getPointAtLength((end + start) / 2);
  while (x < point.x - error || x > point.x + error) {
    // update middle
    point = line.getPointAtLength((end + start) / 2);
    // test
    x < point.x ? end = (start + end) / 2 : start = (start + end ) / 2;
    // update iteration
    if (iterMax < ++ iter) break;
  }
  return point.y;
}

d3.select("#findY")
  .on("click", evt => {
    const x = document.getElementById("someX").value;
    const y = findYFromXLogTime(xScale(x), series.node());
    svg.append("circle")
      .attr("cx", xScale(x) + margin)
      .attr("cy", y + margin)
      .attr("r", 4)
      .attr("fill", "red")
      .attr("stroke", "black")
});<script src="https://cdnjs.cloudflare.com/ajax/libs/d3/6.7.0/d3.min.js"></script>
<input id="someX" type="number">
<button id="findY" type="button">find Y</button>
<div id="viz"></div>
页面原文内容由Stack Overflow提供。腾讯云小微IT领域专用引擎提供翻译支持
原文链接:
https://stackoverflow.com/questions/67331467
复制相关文章
相似问题
腾讯云开发者
