
多个子图的矩阵库
多个子图的矩阵库
提问于 2021-04-29 09:47:17
我想用以下数据绘制多面板图:
CHROM   BIN_START   BIN_END N_VARIANTS  PI

NODE_10_length_497_cov_170.299805   1   10000   39  0.000703581
NODE_13_length_1438_cov_357.659943  1   10000   61  0.00132786
NODE_15_length_733_cov_44.686222    1   10000   25  5.73165e-05
NODE_16_length_8151_cov_58.001228   1   10000   525 0.0129994
NODE_18_length_98839_cov_51.306377  1   10000   753 0.0158054
NODE_18_length_98839_cov_51.306377  10001   20000   644 0.0147527
NODE_18_length_98839_cov_51.306377  20001   30000   783 0.0180735
NODE_18_length_98839_cov_51.306377  30001   40000   433 0.00950069
NODE_18_length_98839_cov_51.306377  40001   50000   568 0.0134851
NODE_18_length_98839_cov_51.306377  50001   60000   634 0.0107662
NODE_18_length_98839_cov_51.306377  60001   70000   501 0.0104874
NODE_18_length_98839_cov_51.306377  70001   80000   736 0.0142129
NODE_18_length_98839_cov_51.306377  80001   90000   803 0.0177756
NODE_18_length_98839_cov_51.306377  90001   100000  683 0.015499
NODE_20_length_219211_cov_54.980137 1   10000   803 0.0188128
NODE_20_length_219211_cov_54.980137 10001   20000   577 0.0152466
NODE_20_length_219211_cov_54.980137 20001   30000   596 0.0149394
NODE_20_length_219211_cov_54.980137 30001   40000   982 0.0230532
NODE_20_length_219211_cov_54.980137 40001   50000   991 0.0211885
NODE_20_length_219211_cov_54.980137 50001   60000   659 0.0154533
NODE_20_length_219211_cov_54.980137 60001   70000   752 0.0171805
NODE_20_length_219211_cov_54.980137 70001   80000   725 0.0168676
NODE_20_length_219211_cov_54.980137 80001   90000   836 0.0199372
NODE_20_length_219211_cov_54.980137 90001   100000  652 0.0116497
NODE_20_length_219211_cov_54.980137 100001  110000  788 0.0176188
NODE_20_length_219211_cov_54.980137 110001  120000  278 0.00549361
NODE_20_length_219211_cov_54.980137 120001  130000  499 0.0120812
NODE_20_length_219211_cov_54.980137 130001  140000  738 0.0161006
NODE_20_length_219211_cov_54.980137 140001  150000  729 0.0148927
NODE_20_length_219211_cov_54.980137 150001  160000  611 0.015047
NODE_20_length_219211_cov_54.980137 160001  170000  737 0.0175226
NODE_20_length_219211_cov_54.980137 170001  180000  709 0.0153575
NODE_20_length_219211_cov_54.980137 180001  190000  688 0.0133387
NODE_20_length_219211_cov_54.980137 190001  200000  693 0.0145321
NODE_20_length_219211_cov_54.980137 200001  210000  564 0.0122298
NODE_20_length_219211_cov_54.980137 210001  220000  687 0.0140385
NODE_22_length_248_cov_293.927429   1   10000   23  0.000482139
NODE_24_length_104_cov_29.778847    1   10000   6   2.73246e-05
NODE_29_length_319744_cov_53.127953 1   10000   759 0.0155234
NODE_29_length_319744_cov_53.127953 10001   20000   741 0.0182896
NODE_29_length_319744_cov_53.127953 20001   30000   709 0.0147025
NODE_29_length_319744_cov_53.127953 30001   40000   755 0.0159811
.
.
.
我使用了下面的python代码。
    import matplotlib.pyplot as plt

    chrs = {}

    with open('diversity_level.windowed.pi', 'r') as f:
        info = f.readlines()

    for i in range(2, len(info)):#skip the first line
        linfo = info[i].split("\t")
        if (linfo[0] in chrs):
        chrs[linfo[0]][0].append(int(linfo[1]))
        chrs[linfo[0]][1].append(float(linfo[4]))
    else:
        chrs[linfo[0]] = [[] for i in range(2)]

    fig, axs = plt.subplots(len(chrs), 1)
    fig.subplots_adjust(wspace=50,hspace=0.1)

    i = 0
    for chr, data in chrs.items():
        axs[i].plot(data[0], data[1])
        axs[i].set_xlabel(chr)
        axs[i].set_ylabel('pi')
        axs[i].grid(True)
        i = i + 1

    plt.show()
得到的结果是
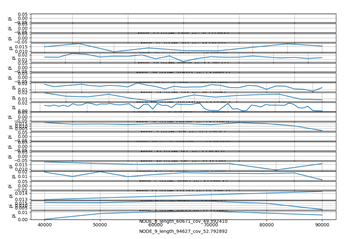
请允许我知道如何调整代码中的参数,以便可以看到每个子图的X轴标签。如何选择不输出空子图。提前感谢
对于gobffi来说,由于所有的数据都在文件多样性_header.windowed.pi中,我如何读取文件中的数据(没有头),并将其放入字典来绘制子图?
from matplotlib.pyplot import show, subplots
data_dict = {}

with open('diversity_level.windowed.pi', 'r') as f:
    data= f.readlines()


for record in range(1,len(data)): #skip the first line header
    key, start, pi = record[0], int(record[1]), float(record[4])
    start_list, pi_list = data_dict.get(key, [[],[]])
    start_list.append(start), pi_list.append(pi)
    data_dict[key] = [start_list, pi_list]
for key in list(data_dict.keys()):
    if len(data_dict[key][0])==1: data_dict.pop(key)

fig, axs = subplots(len(data_dict), constrained_layout=1,
                    sharex=True, sharey=True)

for ax, (key, (start_list, pi_list)) in zip(axs, (data_dict.items())):
    ax.plot(start_list, pi_list)
    ax.set_xlabel(key, size='x-small')
    ax.set_ylabel('pi', size='x-small')
    ax.tick_params(axis='both', labelsize='x-small')
    ax.grid(1);
ax.set_ylim(bottom=0.0)
show()回答 2
Stack Overflow用户
回答已采纳
发布于 2021-04-29 10:59:22
这里是我的尝试,请注意,我对您的代码进行了一些重新组织,因为我感到您使用的索引太多了。
- 要删除“空”序列,我会在键上循环,如果序列的长度正好是1,我就删除(即
pop)相应的字典条目。 - 要解决狭小的图形问题,通常一个好主意是指定图形必须尊重
constrained_layout(这是一个相对较新的特性,imho,确实缺少了这个特性!)
。
from matplotlib.pyplot import show, subplots

# iterate over the lines of a file opened for reading
# each line is a record
data = [record.split() for record in open('your_file_name', 'r')]

data_dict = {}

# we iterate on all the records, except the first one (Python counts from 0)
for record in data[1:]:

    # unpack the "interesting" stuff
    key, start, pi = record[0], int(record[1]), float(record[4])

    # get what is inside the dictionary item, using unpacking
    # if item is "new" we get the default value, that is two empty lists
    start_list, pi_list = data_dict.get(key, [[],[]])

    # append the values to the respective lists
    start_list.append(start), pi_list.append(pi)

    # update the dictionary item with the augmented lists
    data_dict[key] = [start_list, pi_list]

# we remove the "non interesting" entries from the dictionary
# using the `.pop()` method
# note the use of `list(...)` to have a static reference to the keys
for key in list(data_dict.keys()):
    if len(data_dict[key][0])==1: data_dict.pop(key)

# instantiate the figure and the axes, using `constrained_layout`
# usually leads to a better arrangement of the figure elements
fig, axs = subplots(len(data_dict), constrained_layout=1)

# except for a moderate abuse of the unpacking syntax,
# everything should be clear …
for ax, (key, (start_list, pi_list)) in zip(axs, (data_dict.items())):
    ax.plot(start_list, pi_list)
    ax.set_xlabel(key)
    ax.set_ylabel('pi')
    ax.grid(1);
show()
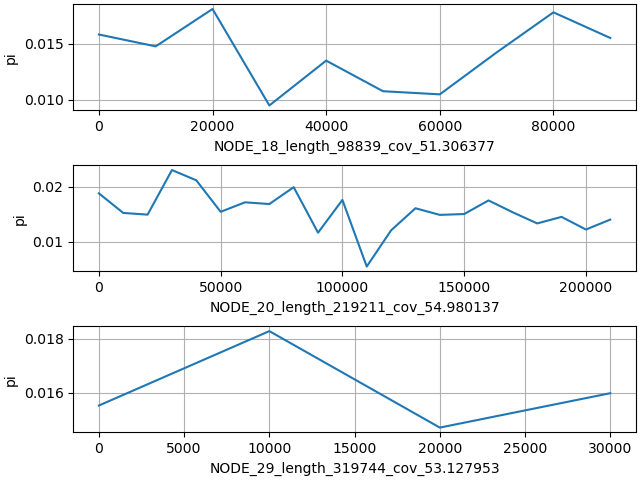
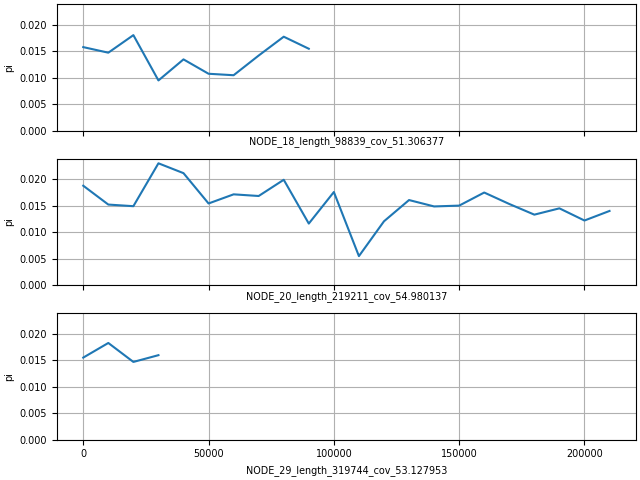
关于这个主题,如果必须对数据实例进行比较,我希望在每个子图中有相同的轴(因此是sharex和shareyin子图`),并且在这个特殊情况下,将下限y设置为零;而且,由于这个数字相当繁忙,这里我将向您展示如何缩小标签和滴答标签的大小。
...

fig, axs = subplots(len(data_dict), constrained_layout=1,
                    sharex=True, sharey=True)

for ax, (key, (start_list, pi_list)) in zip(axs, (data_dict.items())):
    ax.plot(start_list, pi_list)
    ax.set_xlabel(key, size='x-small')
    ax.set_ylabel('pi', size='x-small')
    ax.tick_params(axis='both', labelsize='x-small')
    ax.grid(1);
ax.set_ylim(bottom=0.0)
show()
Stack Overflow用户
发布于 2022-06-13 13:37:30
由于这是一项任务,以下是完整数据的图片:
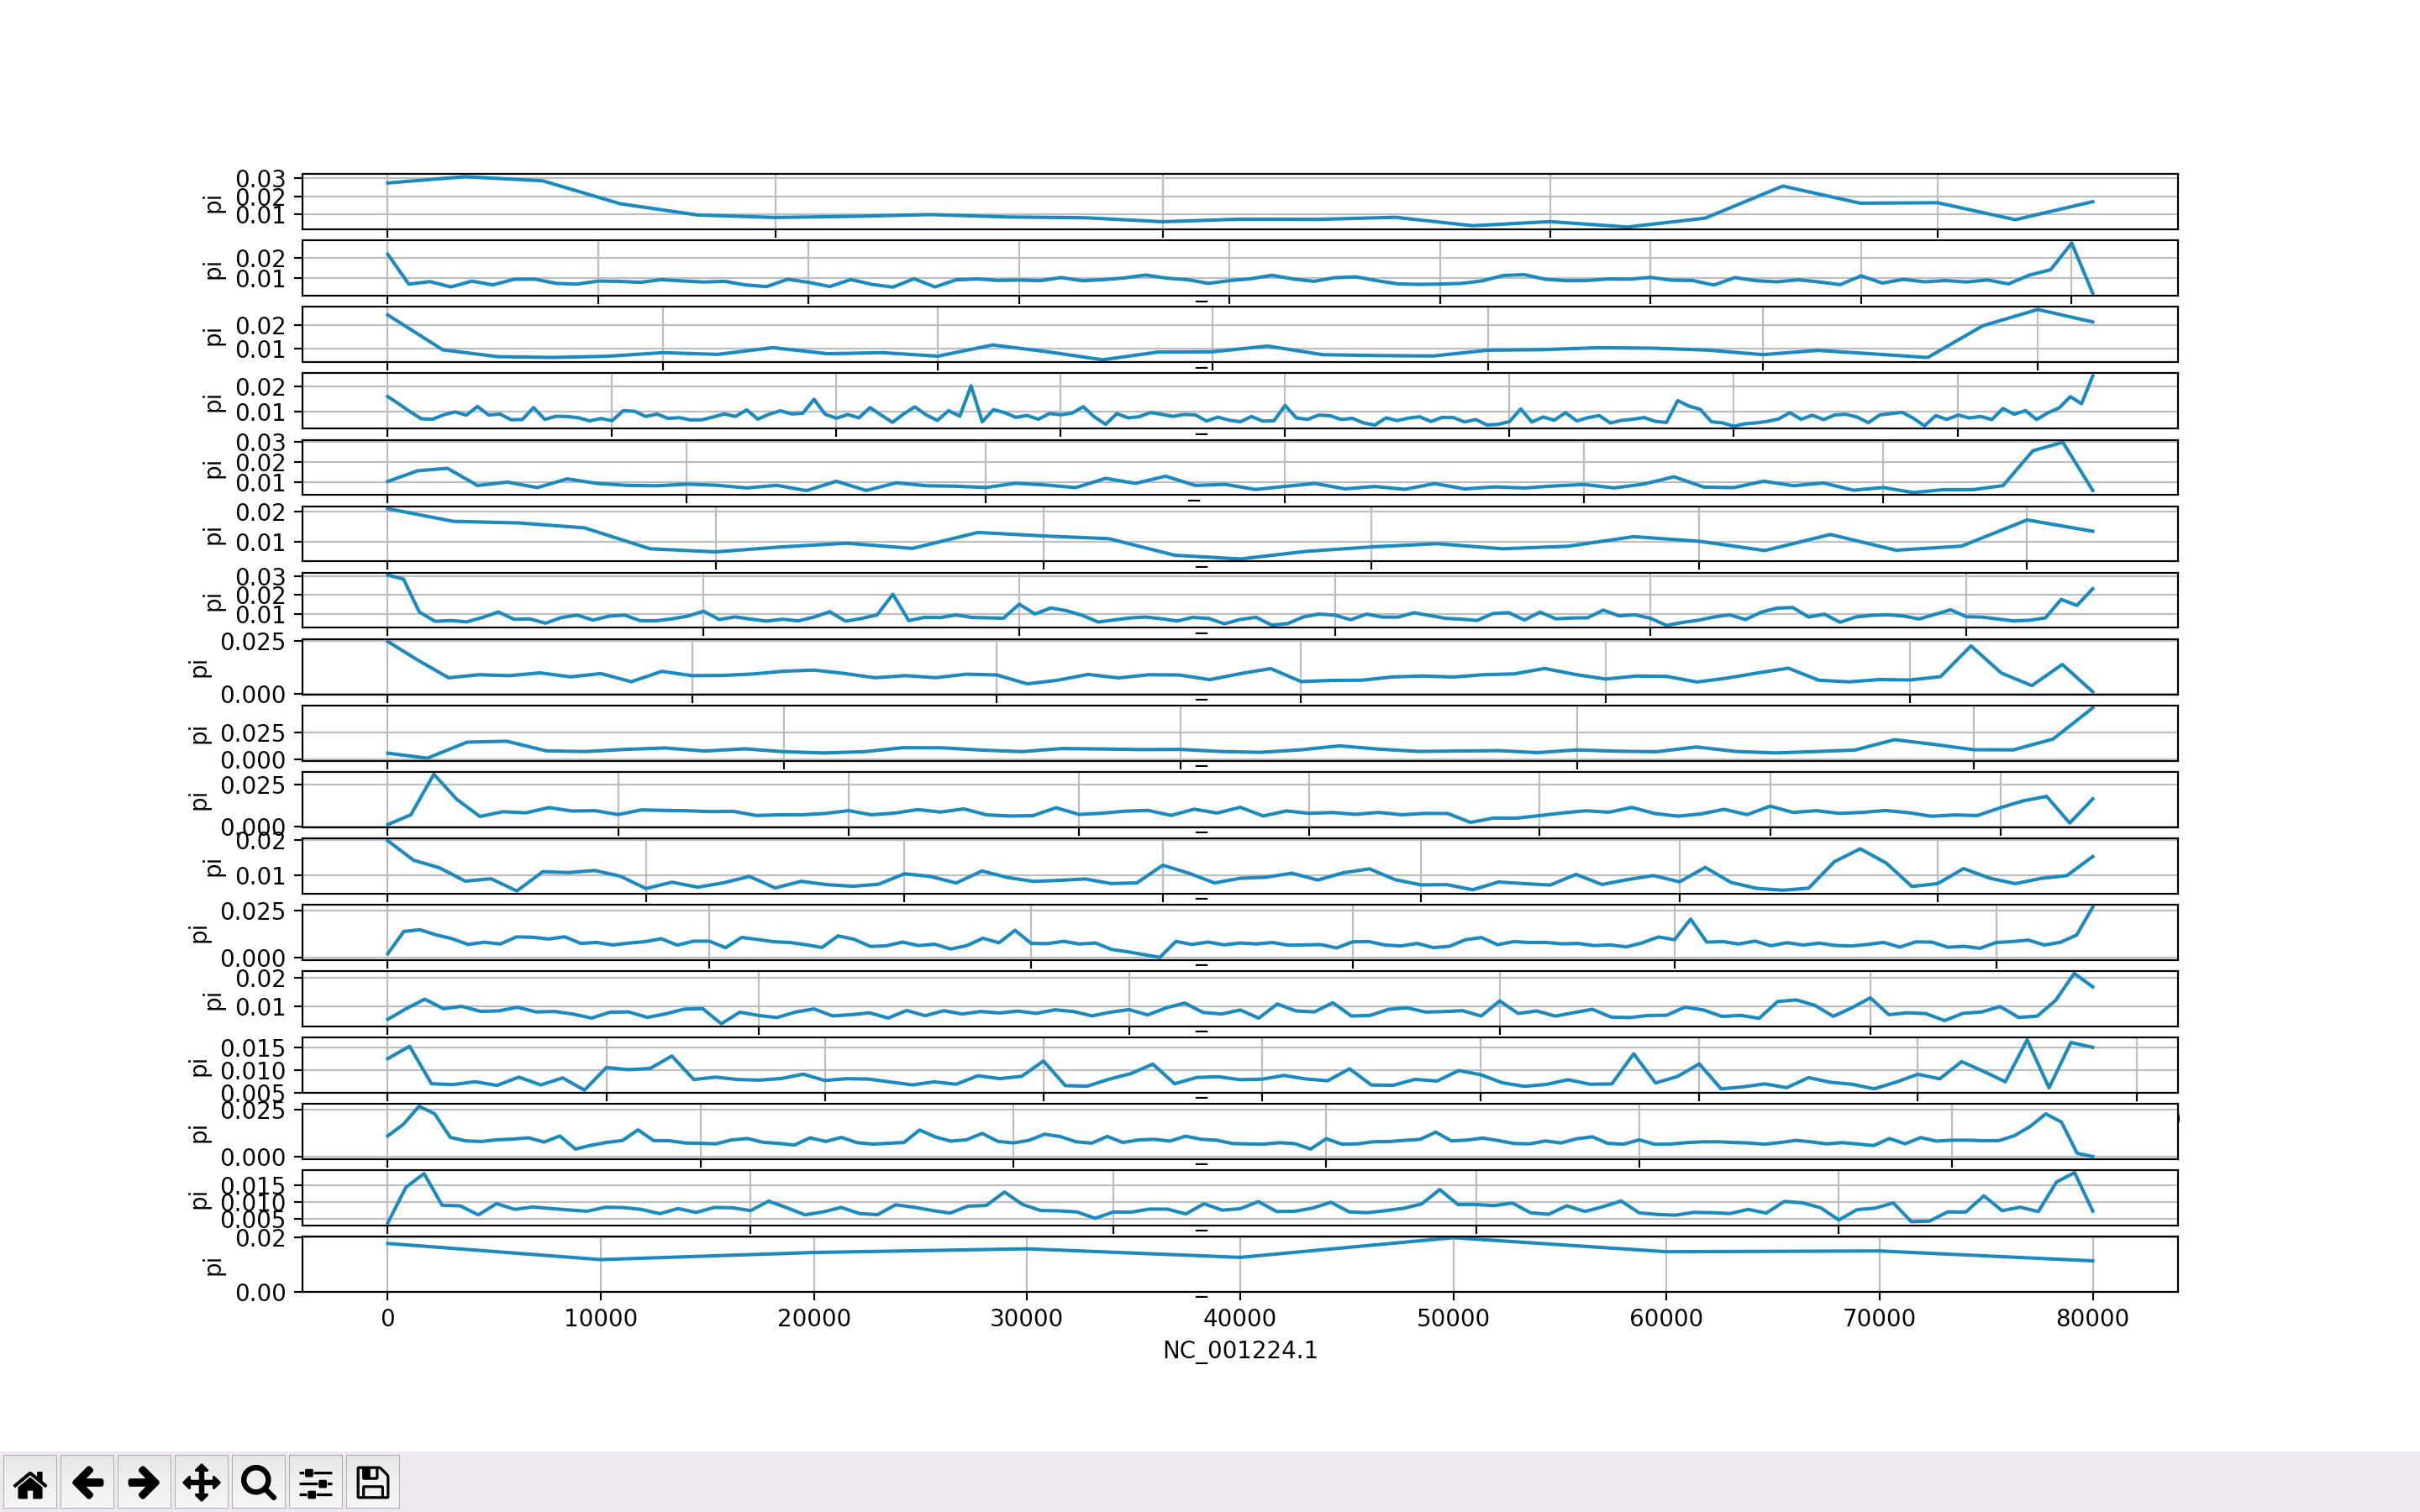
因此,上述所有代码如下:
from matplotlib.pyplot import show, subplots

# iterate over the lines of a file opened for reading
# each line is a record
data = [record.split() for record in open('diversity_level.windowed.pi', 'r')]

data_dict = {}

# we iterate on all the records, except the first one (Python counts from 0)
for record in data[1:]:

    # unpack the "interesting" stuff
    key, start, pi = record[0], int(record[1]), float(record[4])

    # get what is inside the dictionary item, using unpacking
    # if item is "new" we get the default value, that is two empty lists
    start_list, pi_list = data_dict.get(key, [[],[]])

    # append the values to the respective lists
    start_list.append(start), pi_list.append(pi)

    # update the dictionary item with the augmented lists
    data_dict[key] = [start_list, pi_list]

# we remove the "non interesting" entries from the dictionary
# using the `.pop()` method
# note the use of `list(...)` to have a static reference to the keys
for key in list(data_dict.keys()):
    if len(data_dict[key][0])==1: data_dict.pop(key)

# instantiate the figure and the axes, using `constrained_layout`
# usually leads to a better arrangement of the figure elements
fig, axs = subplots(len(data_dict), constrained_layout=1)

# except for a moderate abuse of the unpacking syntax,
# everything should be clear
for ax, (key, (start_list, pi_list)) in zip(axs, (data_dict.items())):
    ax.plot(start_list, pi_list)
    ax.set_xlabel(key)
    ax.set_ylabel('pi')
    ax.grid(1);
ax.set_ylim(bottom=0.0)
show()
页面原文内容由Stack Overflow提供。腾讯云小微IT领域专用引擎提供翻译支持
原文链接:
https://stackoverflow.com/questions/67314932
复制相关文章
相似问题
腾讯云开发者
